Catalyst Construction Economics Hub
Know where the industry is.Know where it's headed.
Data Which Reflects Where the Industry Is Today
NOTE: On January 23rd, 2026, Catalyst hosted Dr. Anirban Basu to gain his insight on the outlook for the 2026 construction economy. Dr. Basu is the Chairman & CEO of Sage Policy Group, Inc., an economic and policy consulting firm headquartered in Baltimore, MD. Dr. Basu currently serves as the Chief Economist at the national level for the Associated Builders and Contractors (ABC). You can access the full recorded video below.
Construction Spending
U.S. Census Bureau - Construction Spending
Year-To-Date Annual Total - Seasonally Adjusted Annual Rate
April 2026 vs. April 2025
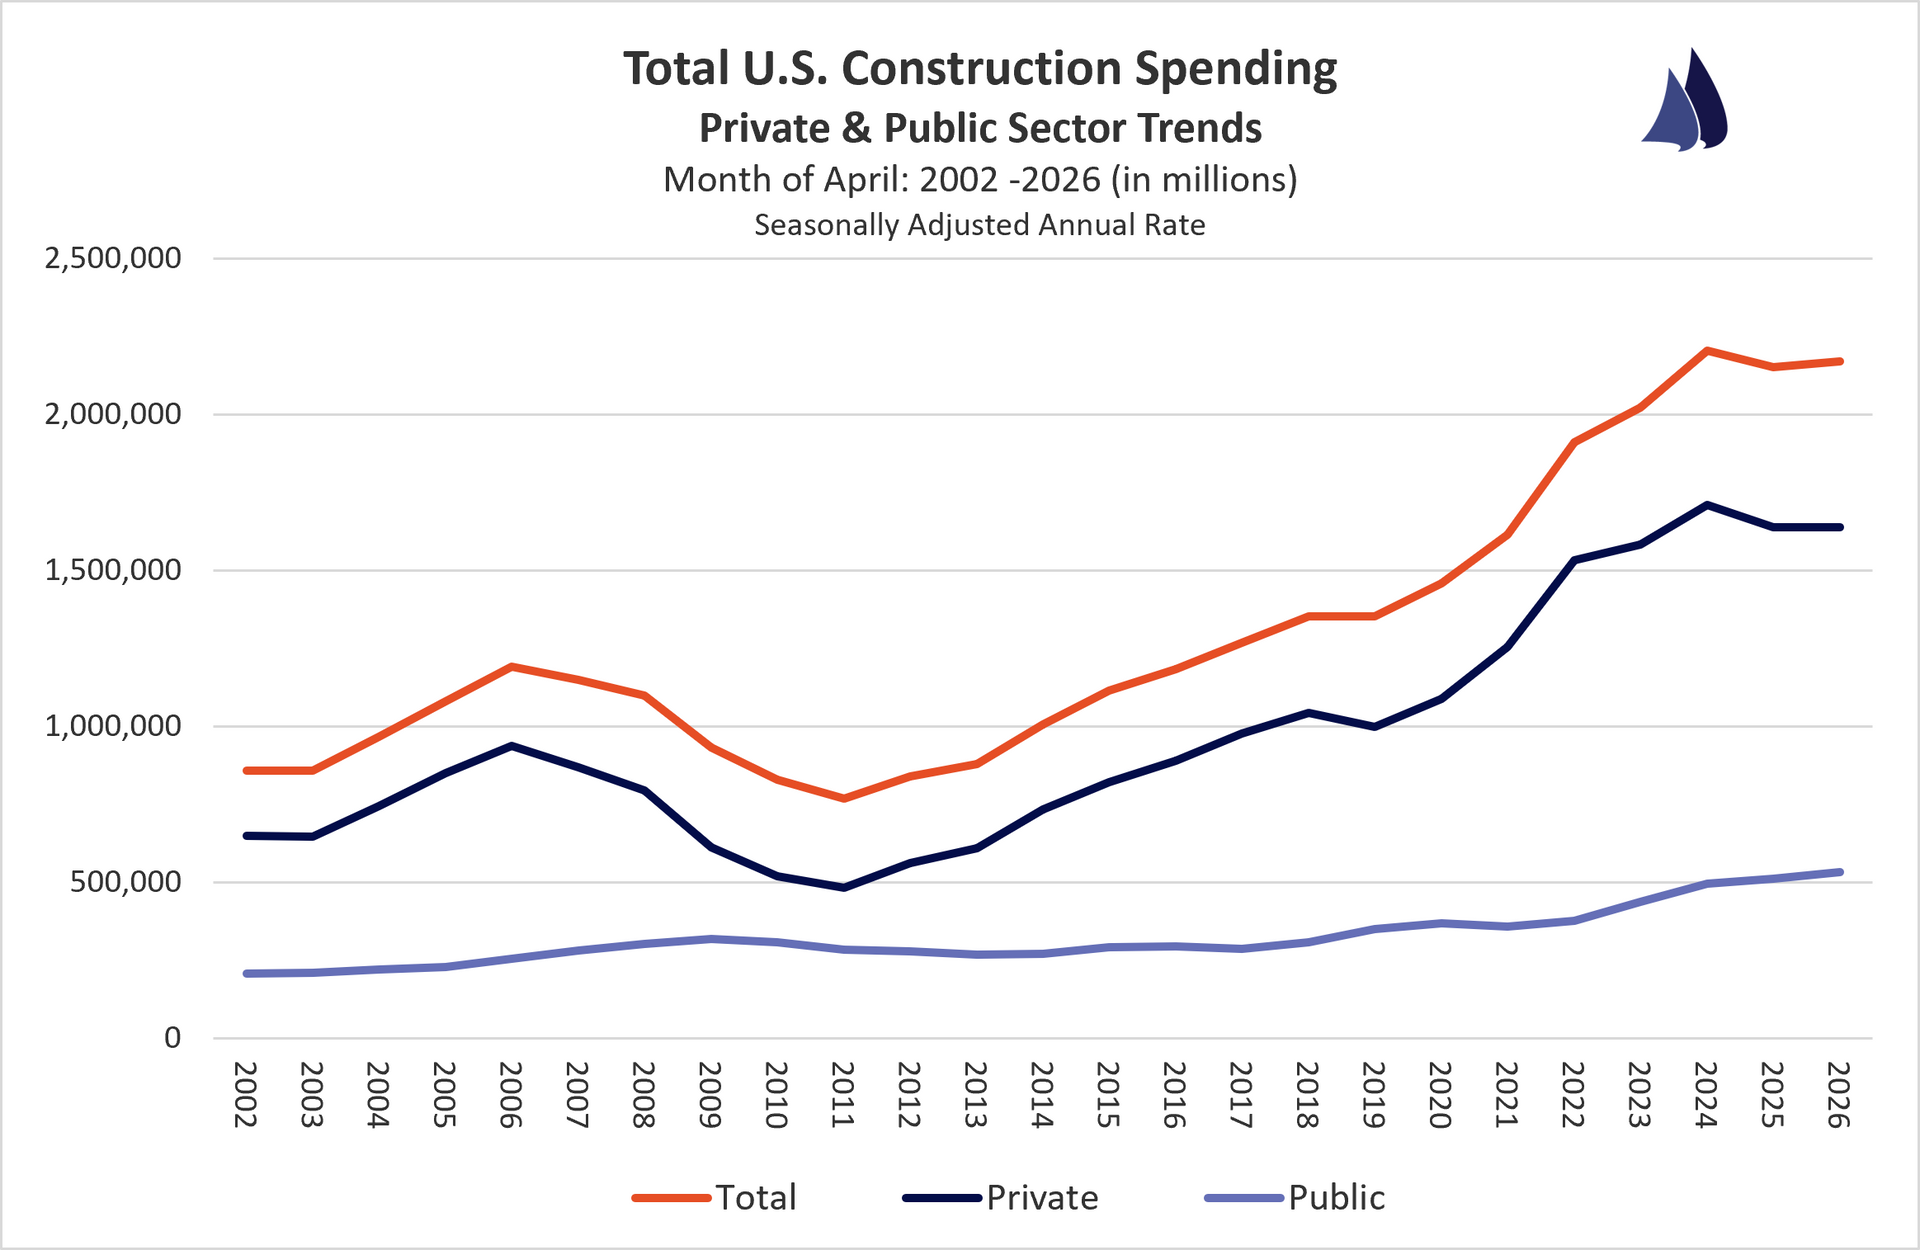
All Construction Spending: +0.9%
Public Construction: +3.7%
Private Construction: 0.0% (flat)
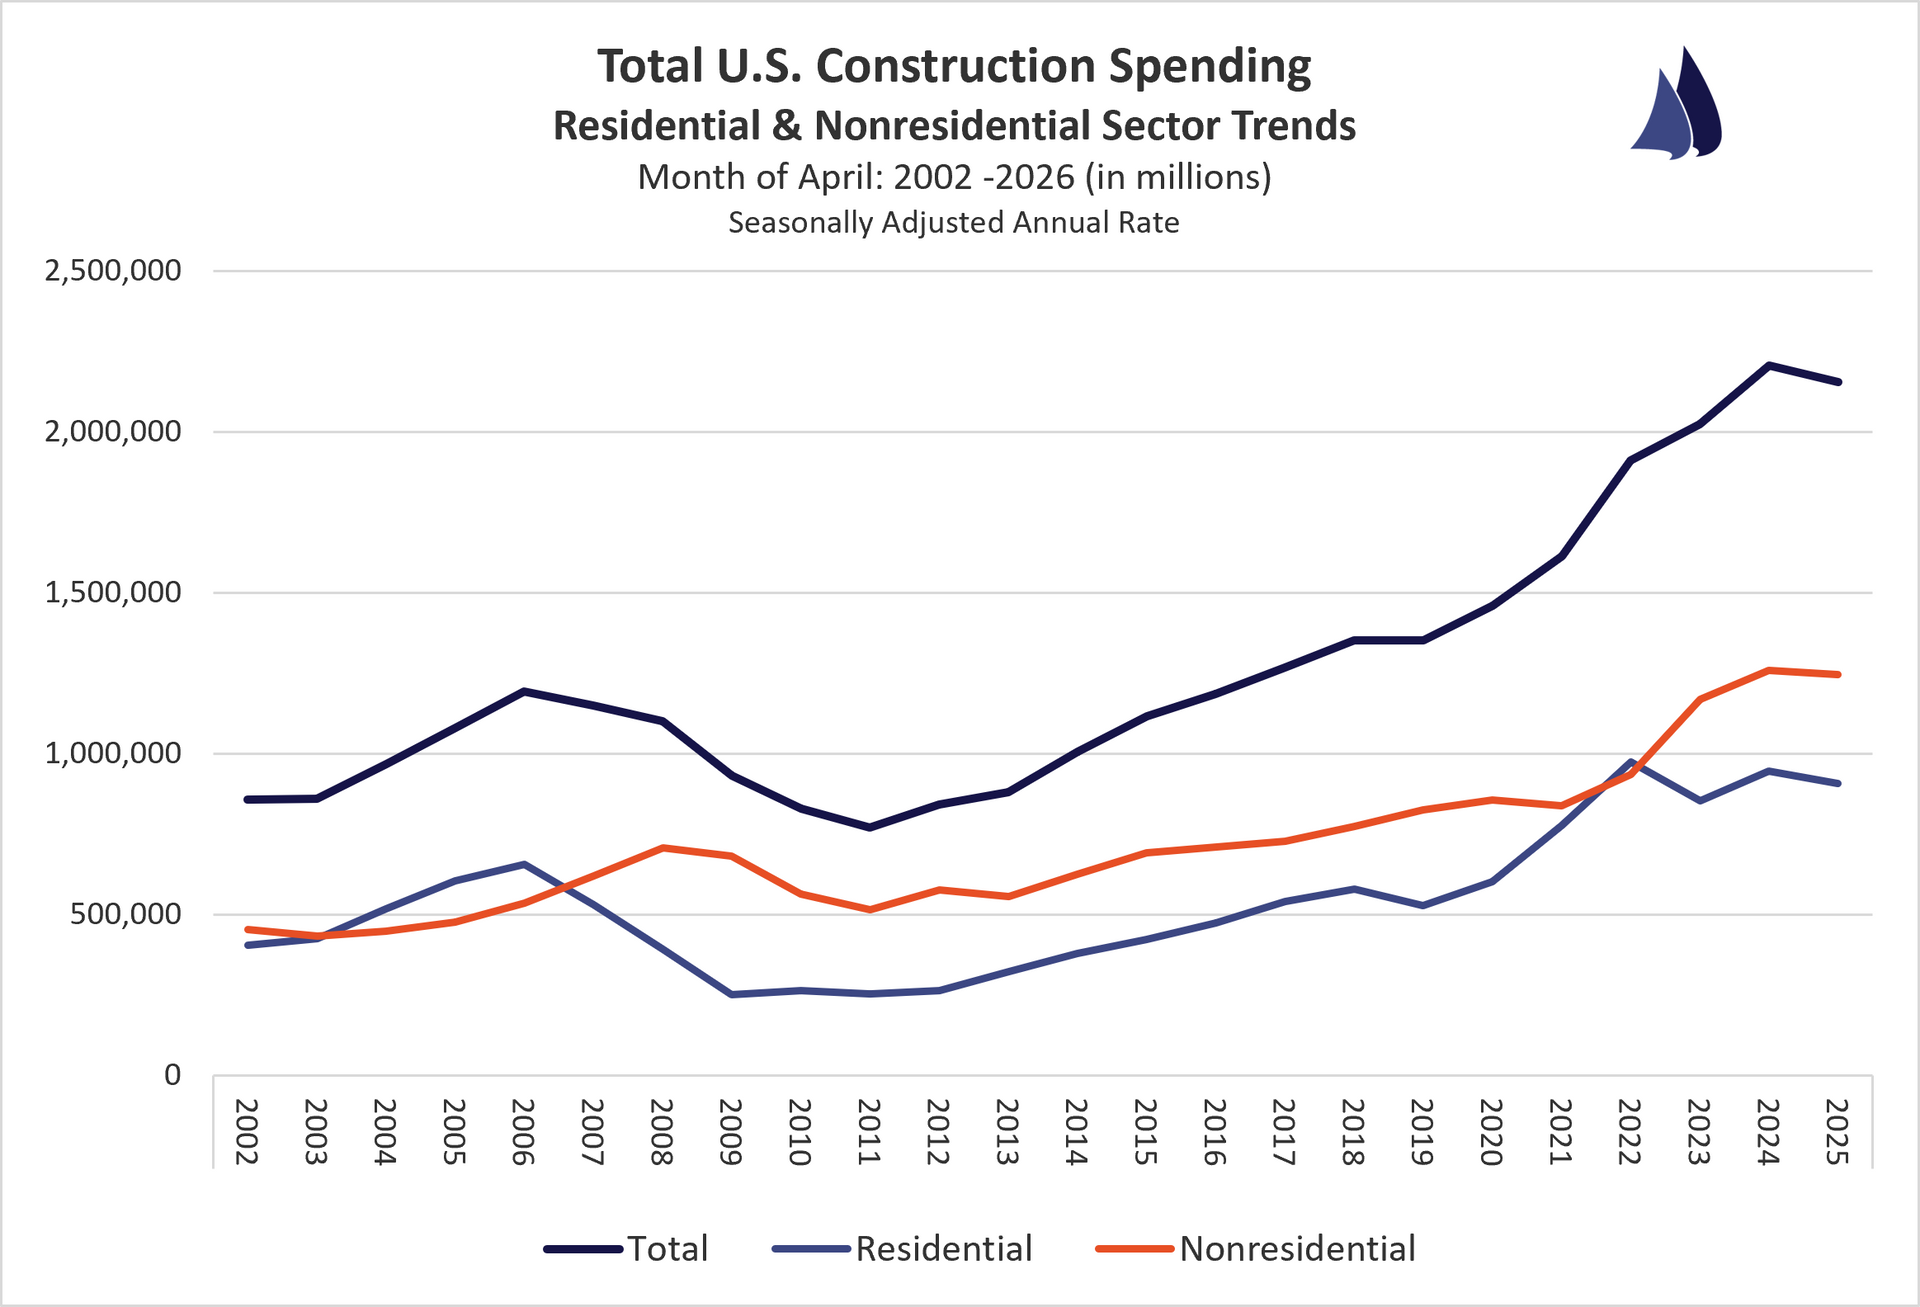
Residential Construction: +1.7%
Non-Residential Construction: +0.3%
Quick Analysis:
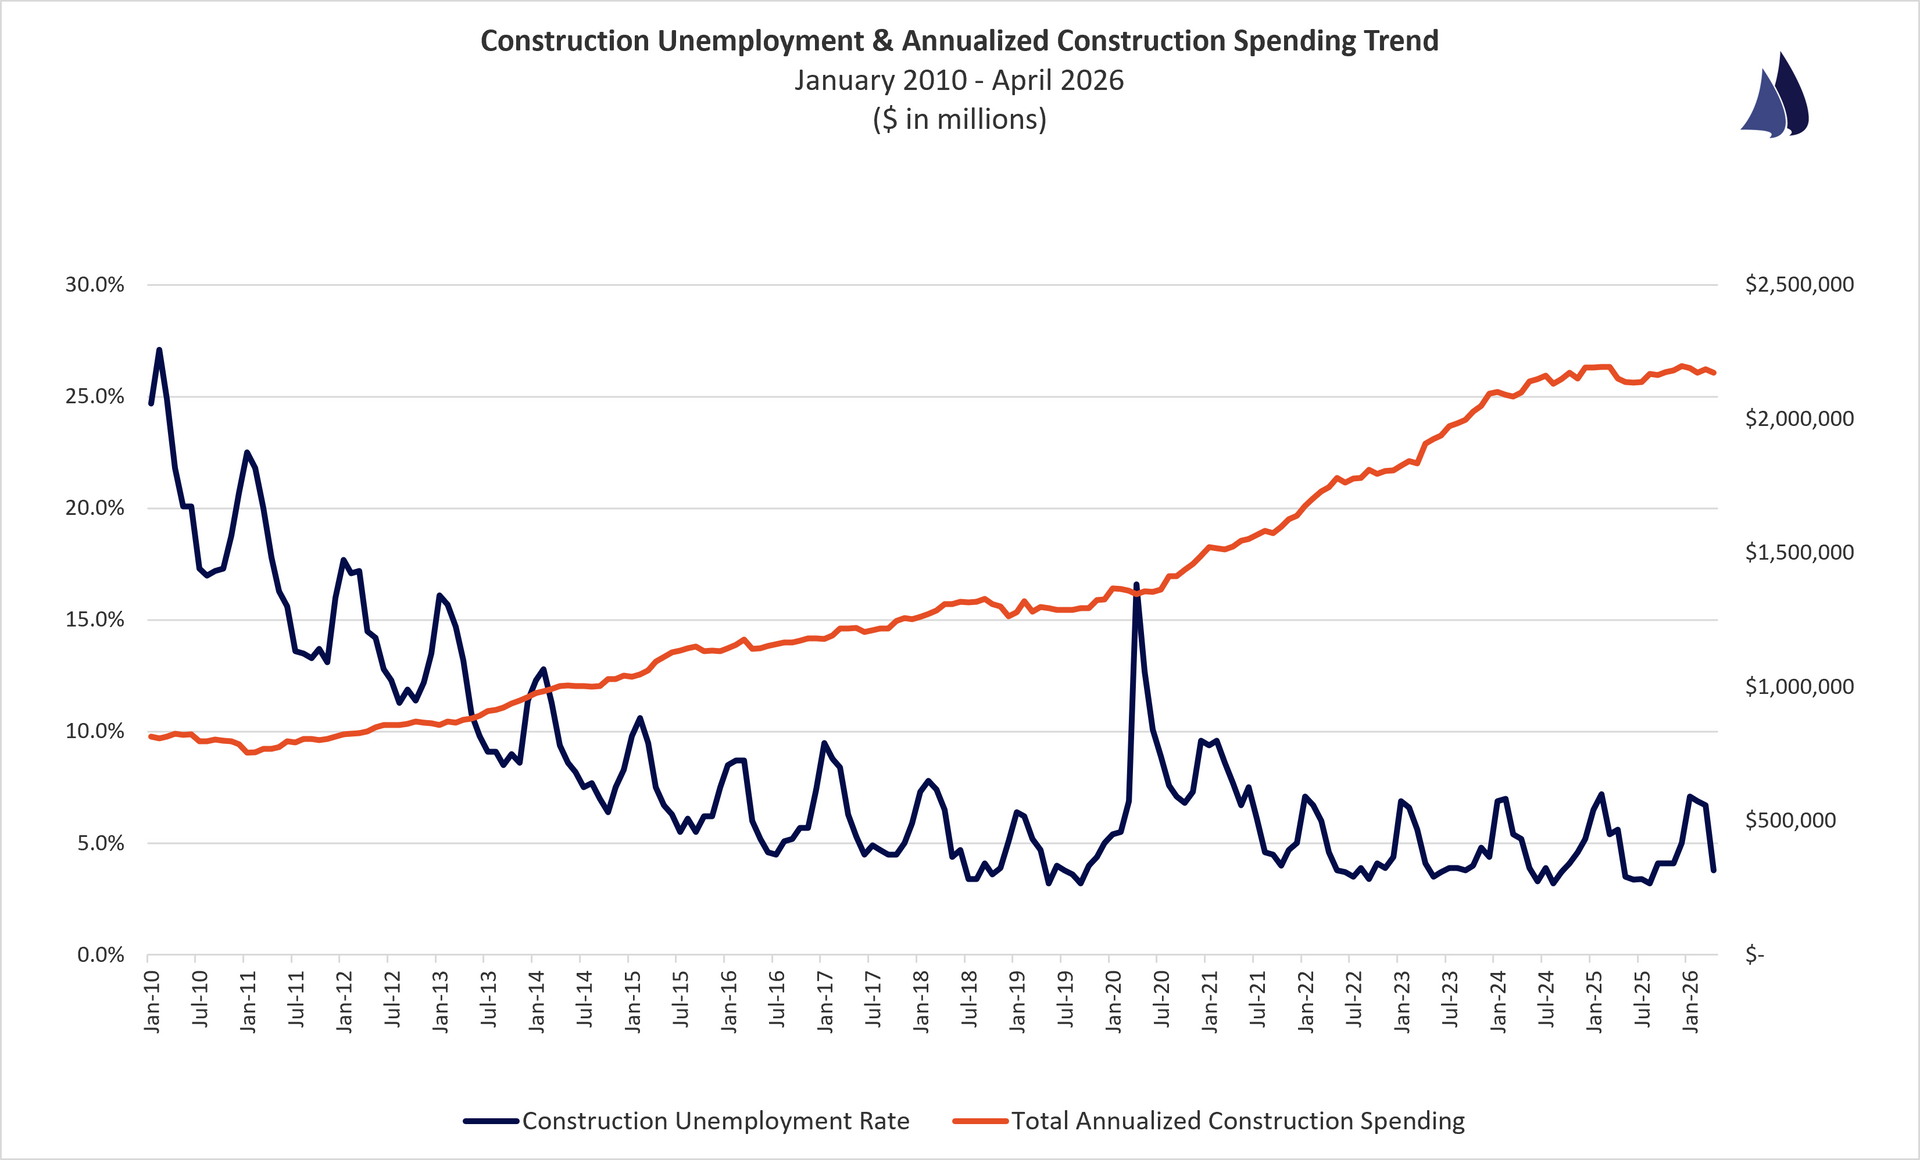
Total construction spending in April 2026 reached a seasonally adjusted annual rate of $2,172.4 billion, up 0.9% from April 2025's $2,153.4 billion, with growth driven primarily by residential construction, which climbed 1.7% year over year to $922.0 billion. Nonresidential spending was roughly flat, up just 0.3% from a year ago, as continued strength in office (up 7.5%), power (up 6.8%), and religious construction (up 20.3%) was largely offset by a steep 18.4% decline in manufacturing spending. Public construction outpaced private growth, rising 3.7% year over year to $532.7 billion, with conservation and development (up 17.5%) and power projects (up 13.9%) showing the strongest gains.
https://www.census.gov/construction/c30/c30index.html
Construction Costs
ENR Construction Cost Index
June 2026 vs. June 2025
Total Construction Costs: +2.8%
Building Cost Index: +4.1%
Material Cost Index: +6.5%
Skilled Labor Costs: +2.0%
Common Labor Costs: +1.3%
Quick Analysis:
ENR's latest Construction Economics data shows annual cost inflation continuing to climb, with total construction costs up 2.8% and materials costs leading the way at 6.5% year over year. The Building Cost Index rose 4.1% annually, outpacing the broader Construction Cost Index, while labor costs remained comparatively modest, with skilled labor up 2.0% and common labor up 1.3%.
http://enr.construction.com/economics/
Construction Employment
U.S. Bureau of Labor Statistics
May 2026
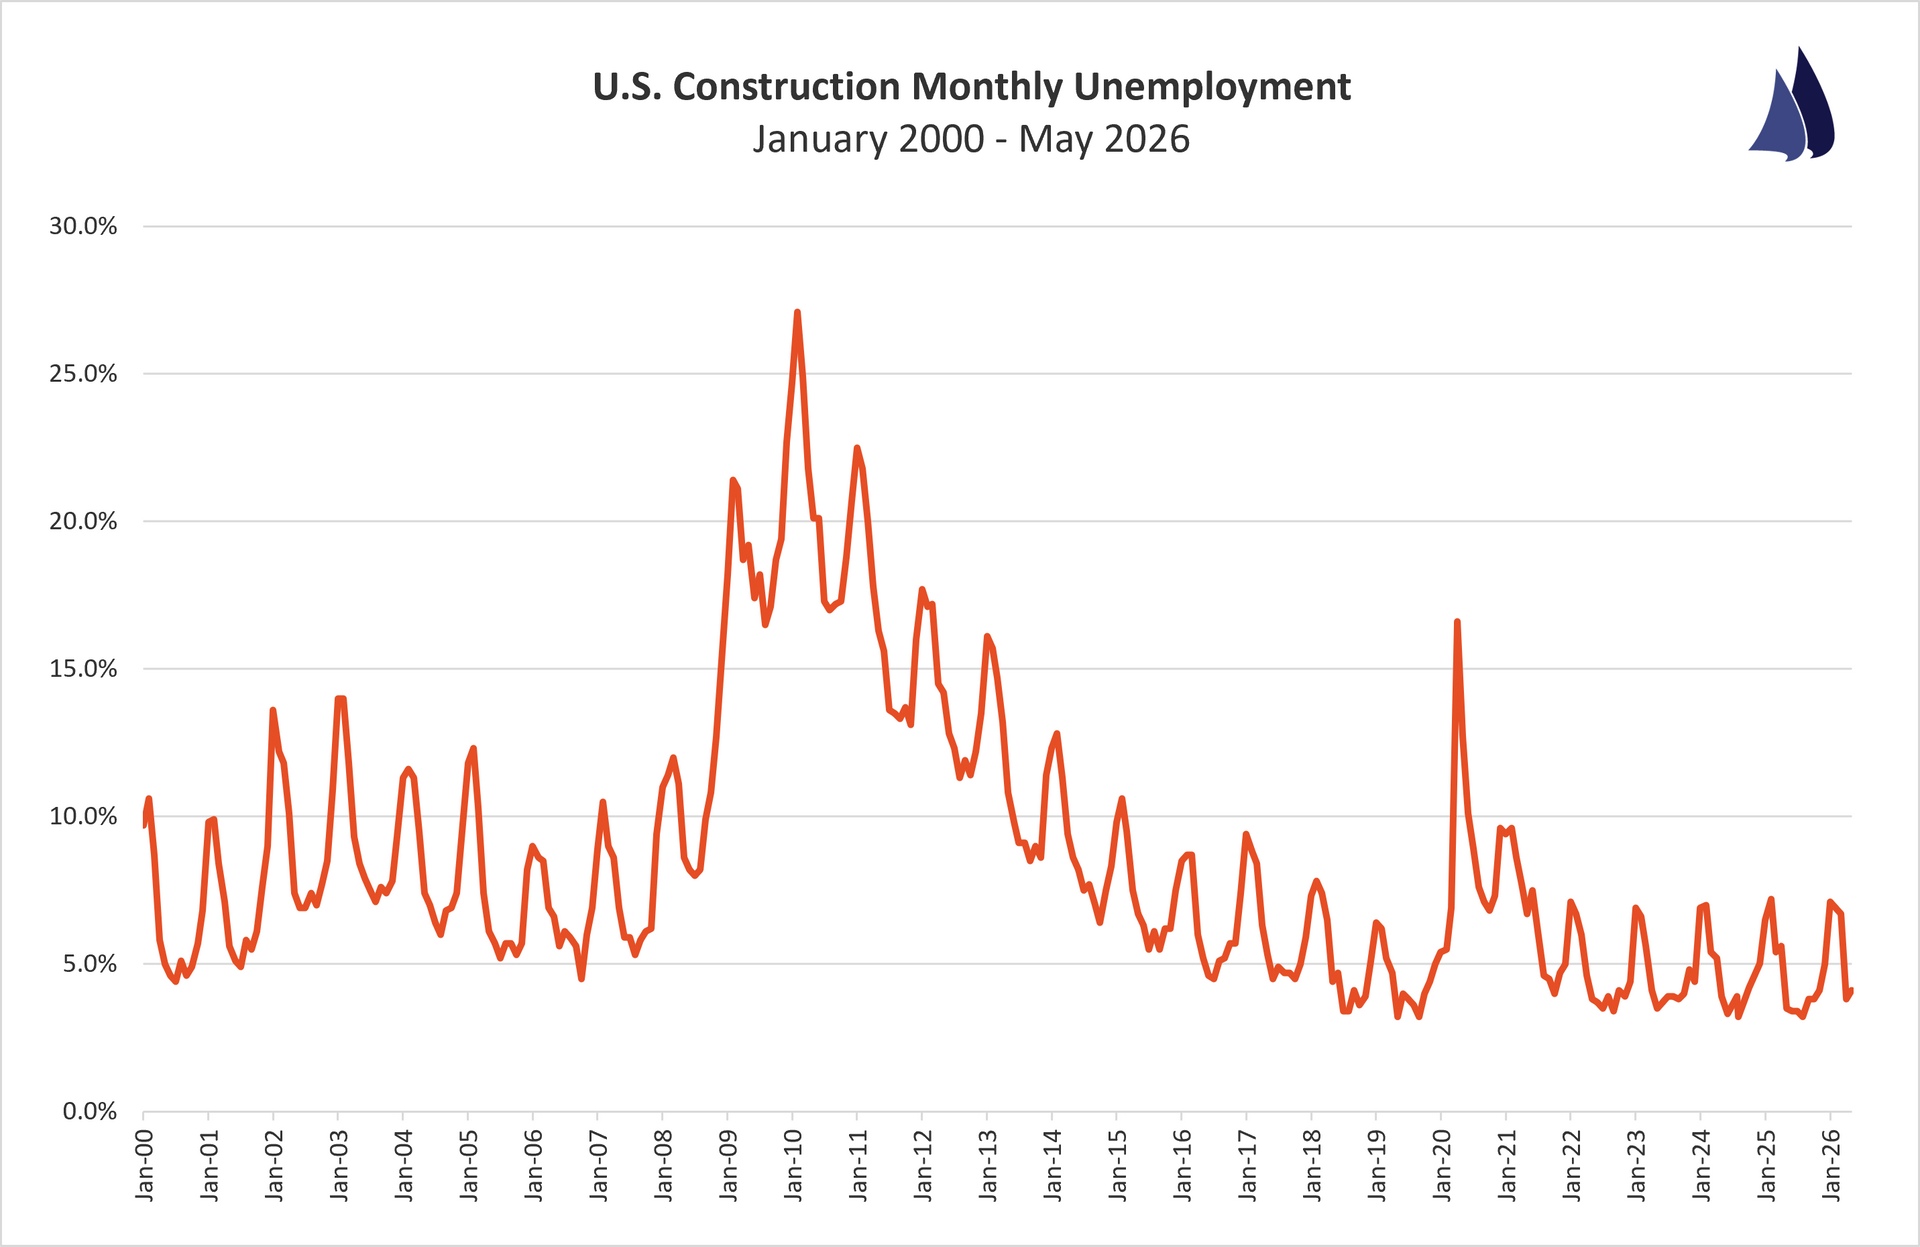
Construction Unemployment: 4.1%
Quick Analysis:
The construction unemployment rate ticked up to 4.1% in May 2026, a slight increase from April's 3.8% but still well within the typical seasonal range for the spring building season. Compared to May 2025's 3.5%, the rate is 0.6 percentage points higher, continuing the pattern seen throughout 2026 of running above prior-year levels each month. Despite this year-over-year softening, May's 4.1% remains historically low by longer-term standards, sitting well below the 2010-2015 recovery-era readings and roughly in line with pre-pandemic norms from 2018-2019.
http://data.bls.gov/timeseries/LNU04032231?data_tool=XGtable
Contractor Backlogs
ABC Backlog Indicator
March 2026 (1st Quarter)
National Avg. Backlog: 8.6 months
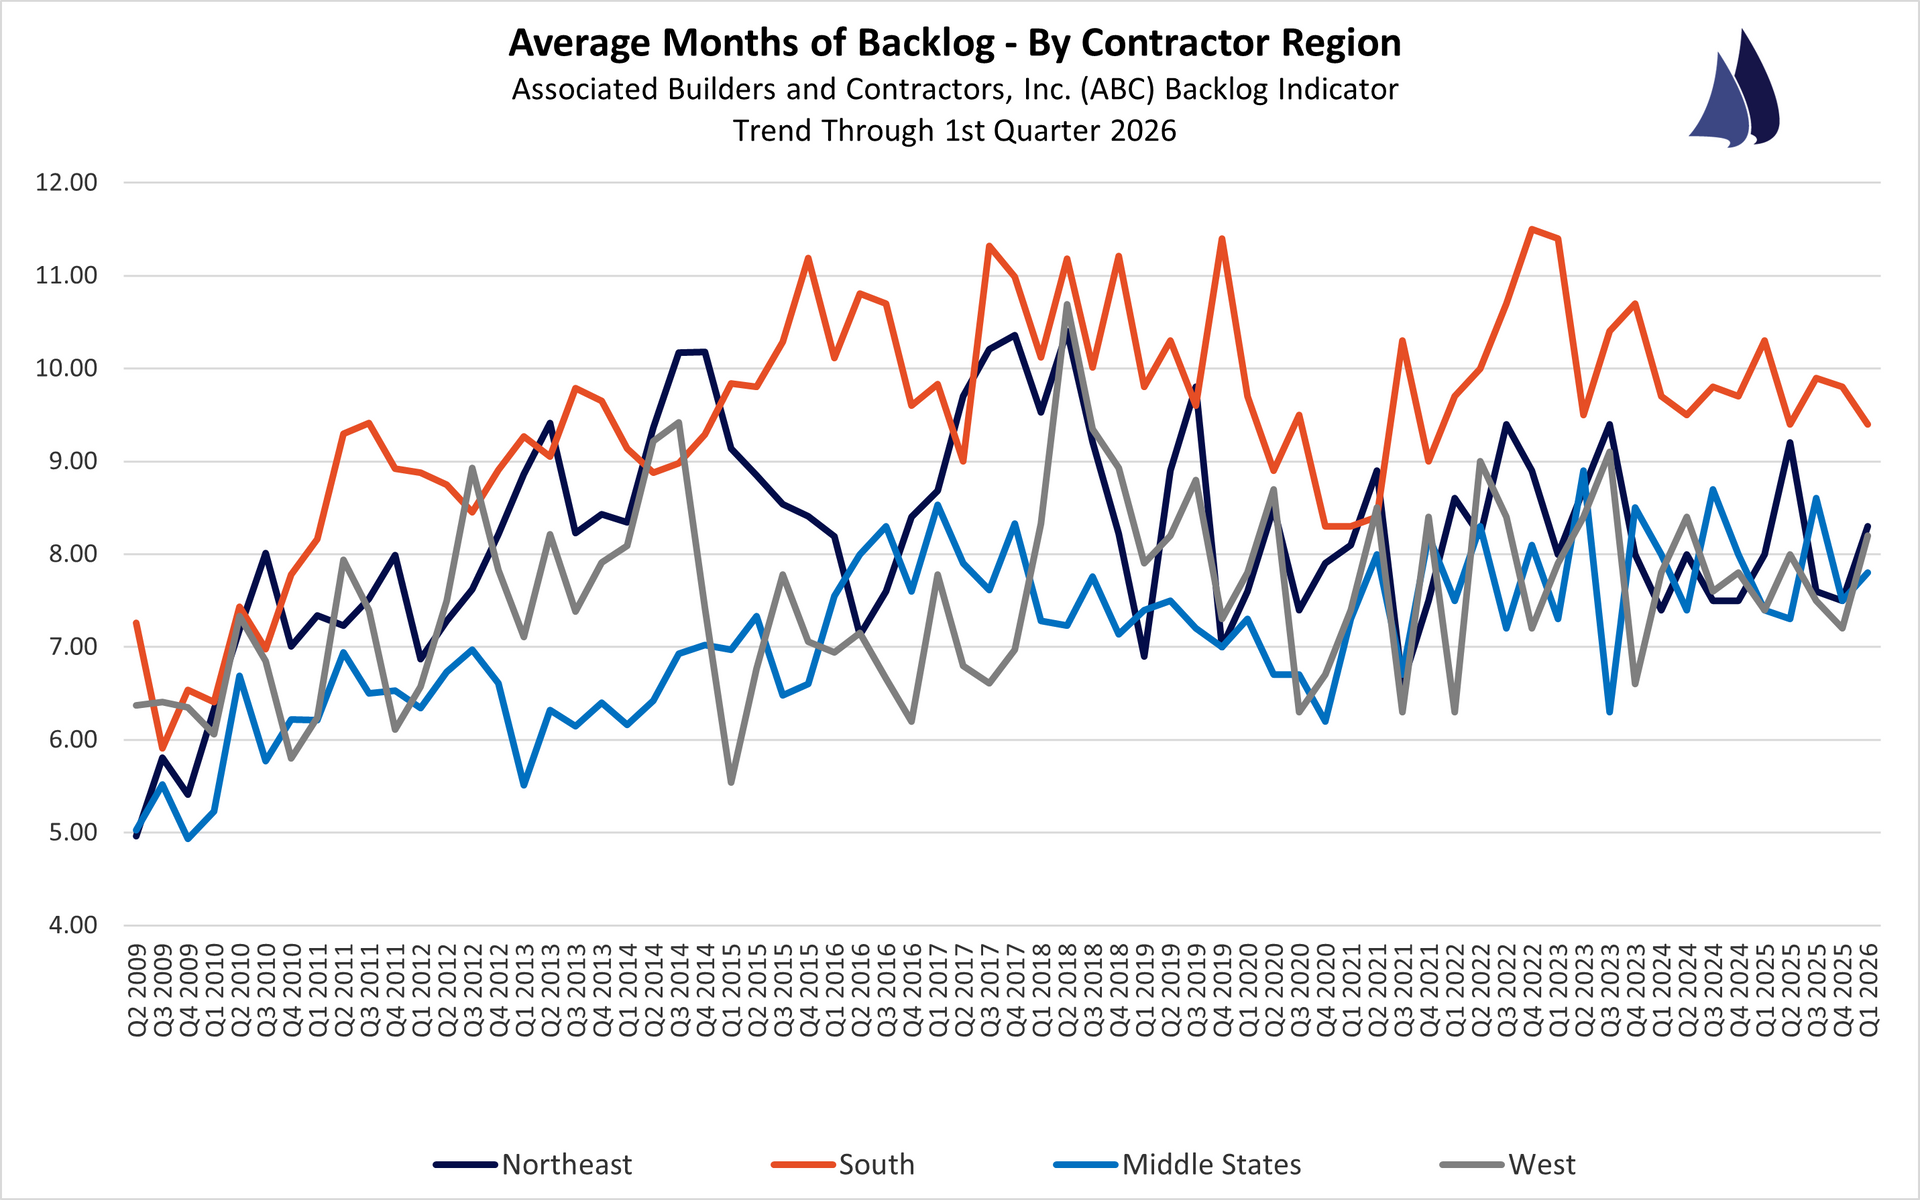
Backlog By Region:
South: 9.4 months Northeast: 8.3 months Middle States: 7.8 months West: 8.2 months
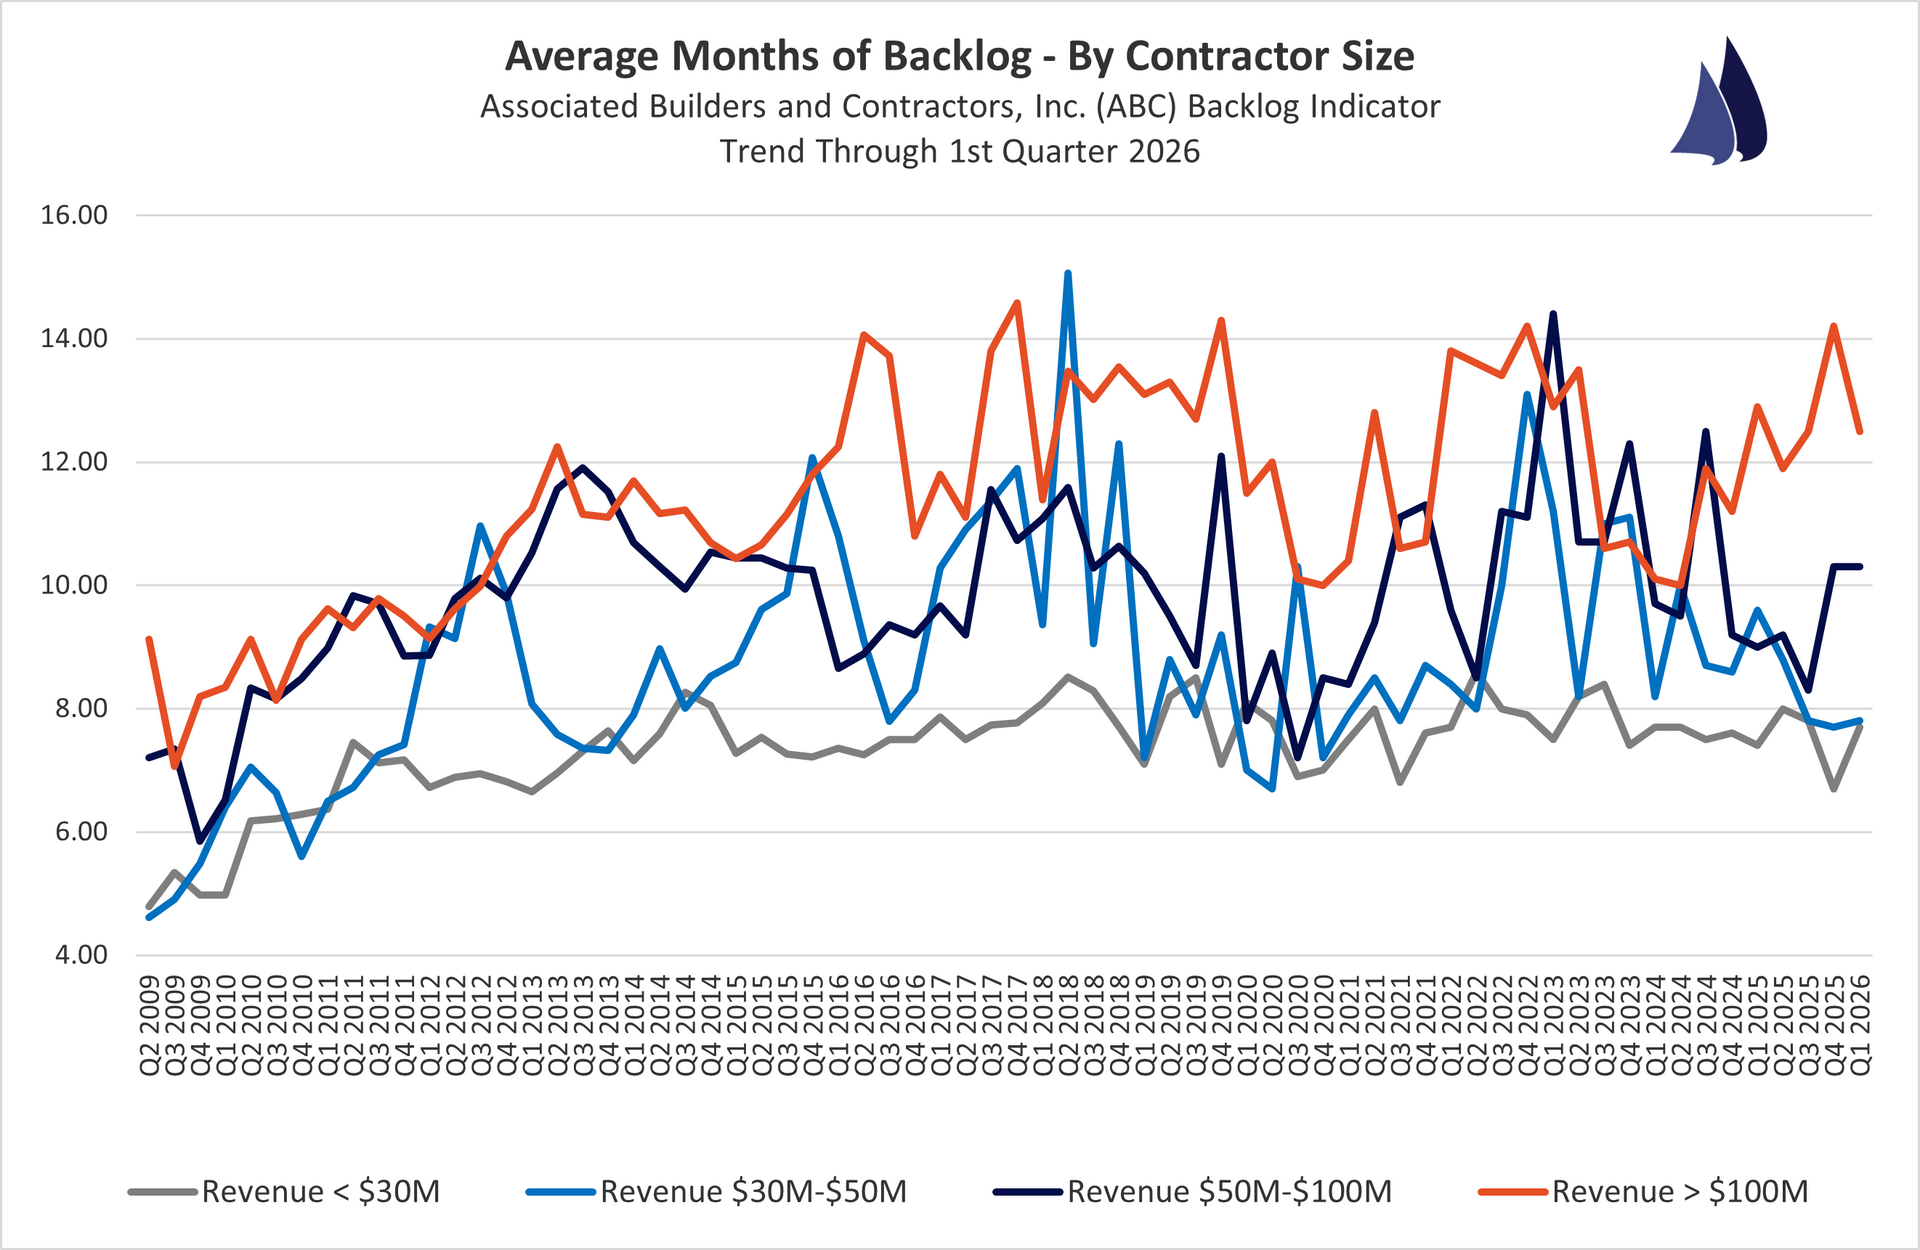
Backlog By Company Revenue:
<$30 Million: 7.7 months $30-$50 Million : 7.8 months $50-$100 Million: 10.3 months >$100 Million: 12.5 months
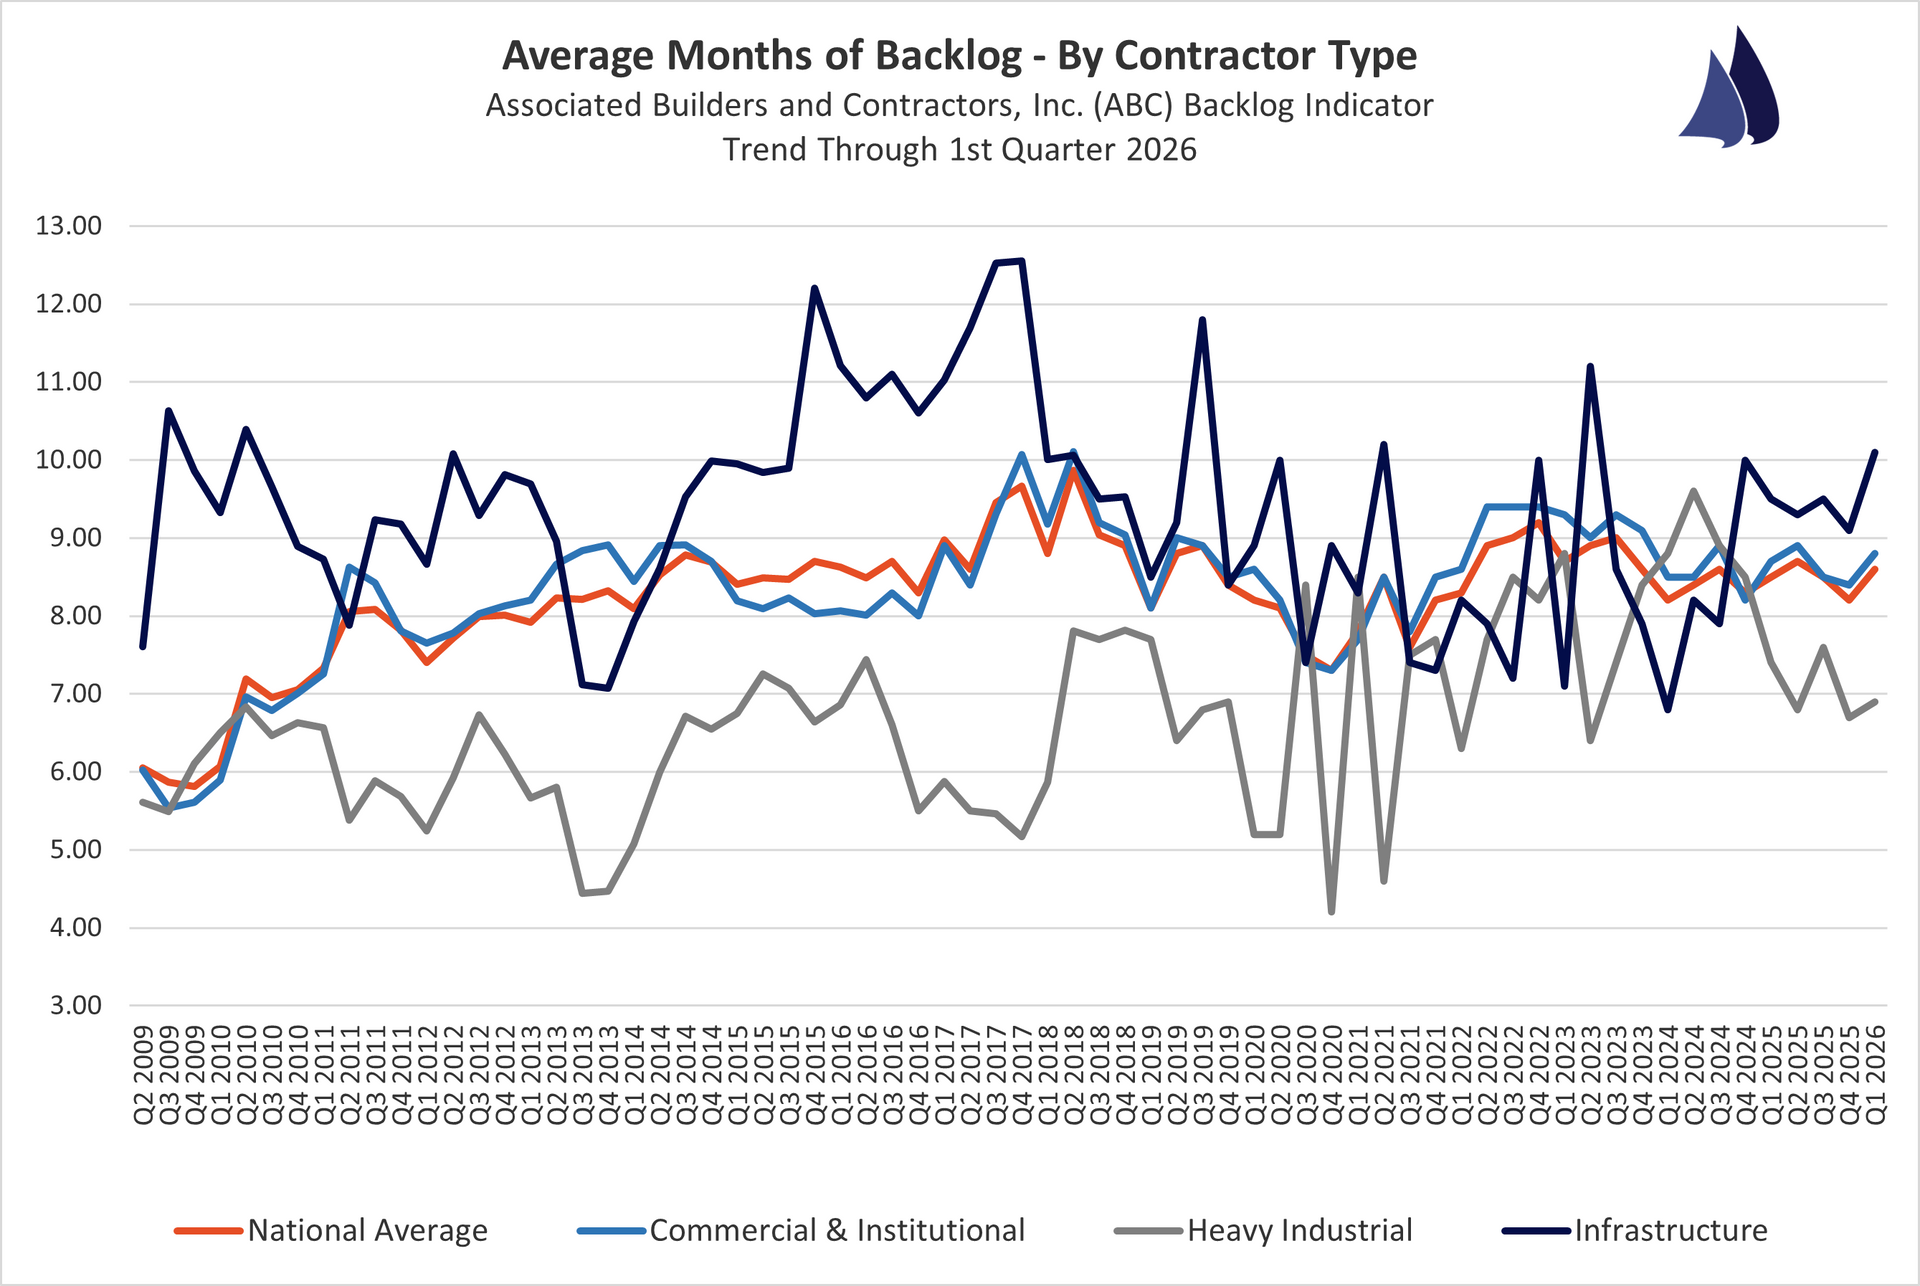
Backlog By Industry:
Commercial & Institutional: 8.8 months | Heavy Industrial: 6.9 months | Infrastructure: 10.1 months
Quick Analysis:
ABC's Construction Backlog Indicator rose to 8.6 months in March, up 0.5 months from February and fully recovered from January's four-year low, with contractor confidence on profit margins and staffing both above year-ago levels. Contractors with data center work continue to report notably longer backlogs (10.6 months) compared to those without (8.3 months), underscoring the outsized role that sector plays in industry workloads. All three components of ABC's Construction Confidence Index remain above 50, signaling expected growth over the next six months, though ABC's chief economist cautioned that a prolonged conflict in Iran could put continued upward pressure on oil prices and borrowing costs.
http://www.abc.org/NewsMedia/ConstructionEconomics/ConstructionBacklogIndicator/
Data Which Reflects Where the Industry Is Headed
Architectural Billings
AIA Architectural Billings Index
May 2026
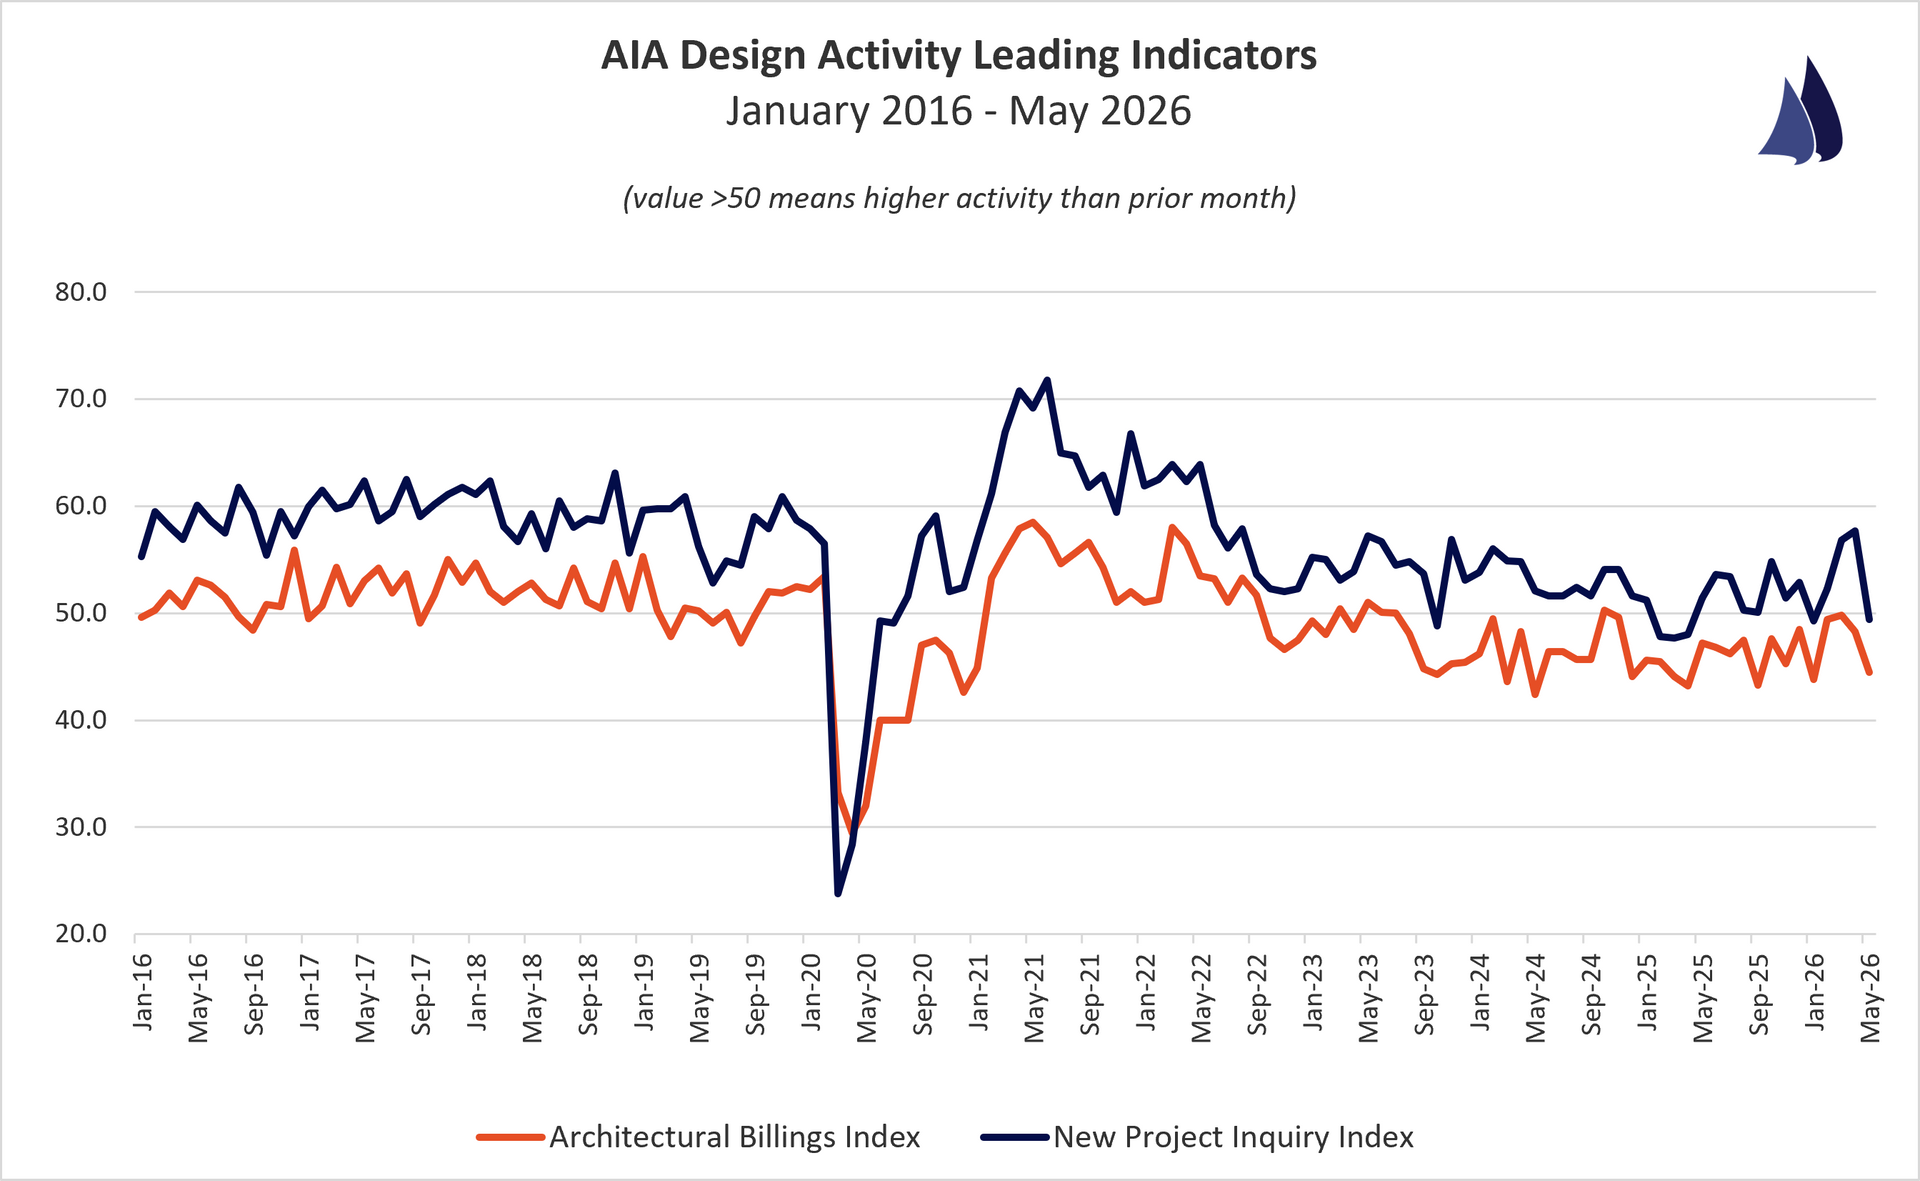
Architectural Billings Index (ABI): 44.5
New Design Contract Index (DCI): 45.0
Commercial/Industrial ABI: 45.5
Institutional ABI: 46.9
Multi-Family Residential ABI: 49.2
Mixed Practice ABI: 44.1
South Region ABI: 49.6
West Region ABI: 45.4
Midwest Region ABI: 45.3
Northeast Region ABI: 46.2
New Project Inquiry Index (NPII): 49.4
Quick Analysis:
Index value > 50 represents that architects have reported more activity for that particular metric than the prior month. These metrics are leading indicators as the ABI reflects projects in design that will enter the construction phase in 9 to 12 months and the NPII reflects new project demand from owners to potentially enter the design phase.
The AIA Architecture Billings Index fell to 44.5 in May, its lowest reading since January, as continued uncertainty from the Iran conflict, higher energy costs, and rising material prices weighed on demand. The decline was broad based, with billings softening across all regions and specializations and the inquiries index dropping below 50 for the first time in four months. Looking ahead, architect sentiment has also weakened, with about a quarter of firm leaders now expecting billings to decline in the third quarter, up from 21% who expected a Q2 decline at the end of Q1.
http://new.aia.org/press-releases