Catalyst Construction Economics Hub
Know where the industry is.Know where it's headed.
Data Which Reflects Where the Industry Is Today
NOTE: On January 23rd, 2026, Catalyst hosted Dr. Anirban Basu to gain his insight on the outlook for the 2026 construction economy. Dr. Basu is the Chairman & CEO of Sage Policy Group, Inc., an economic and policy consulting firm headquartered in Baltimore, MD. Dr. Basu currently serves as the Chief Economist at the national level for the Associated Builders and Contractors (ABC). You can access the full recorded video below.
Construction Spending
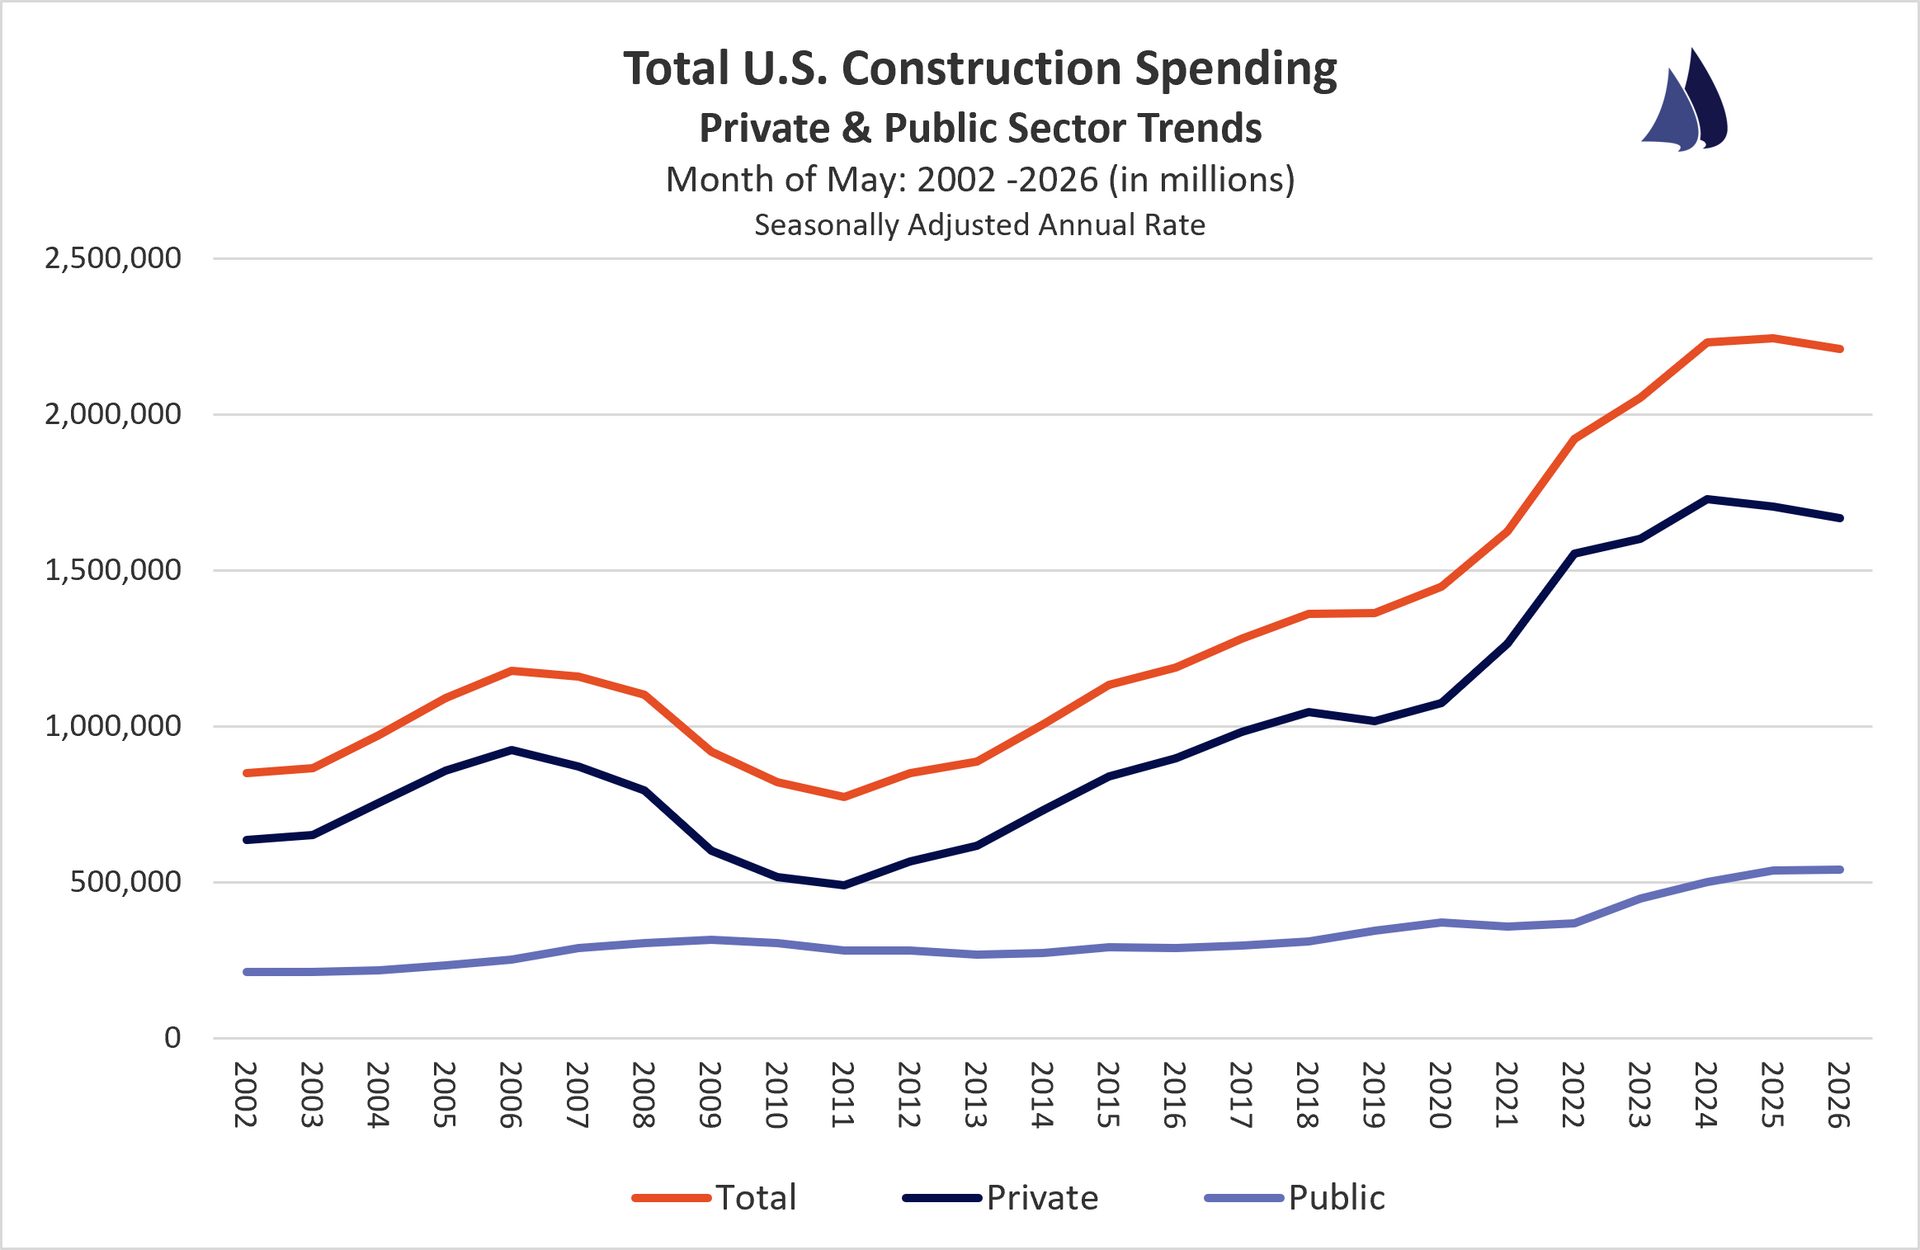
U.S. Census Bureau - Construction Spending
Year-To-Date Annual Total - Seasonally Adjusted Annual Rate
May 2026 vs. May 2025
All Construction Spending: -1.5%
Public Construction: +0.3%
Private Construction: -2.1%
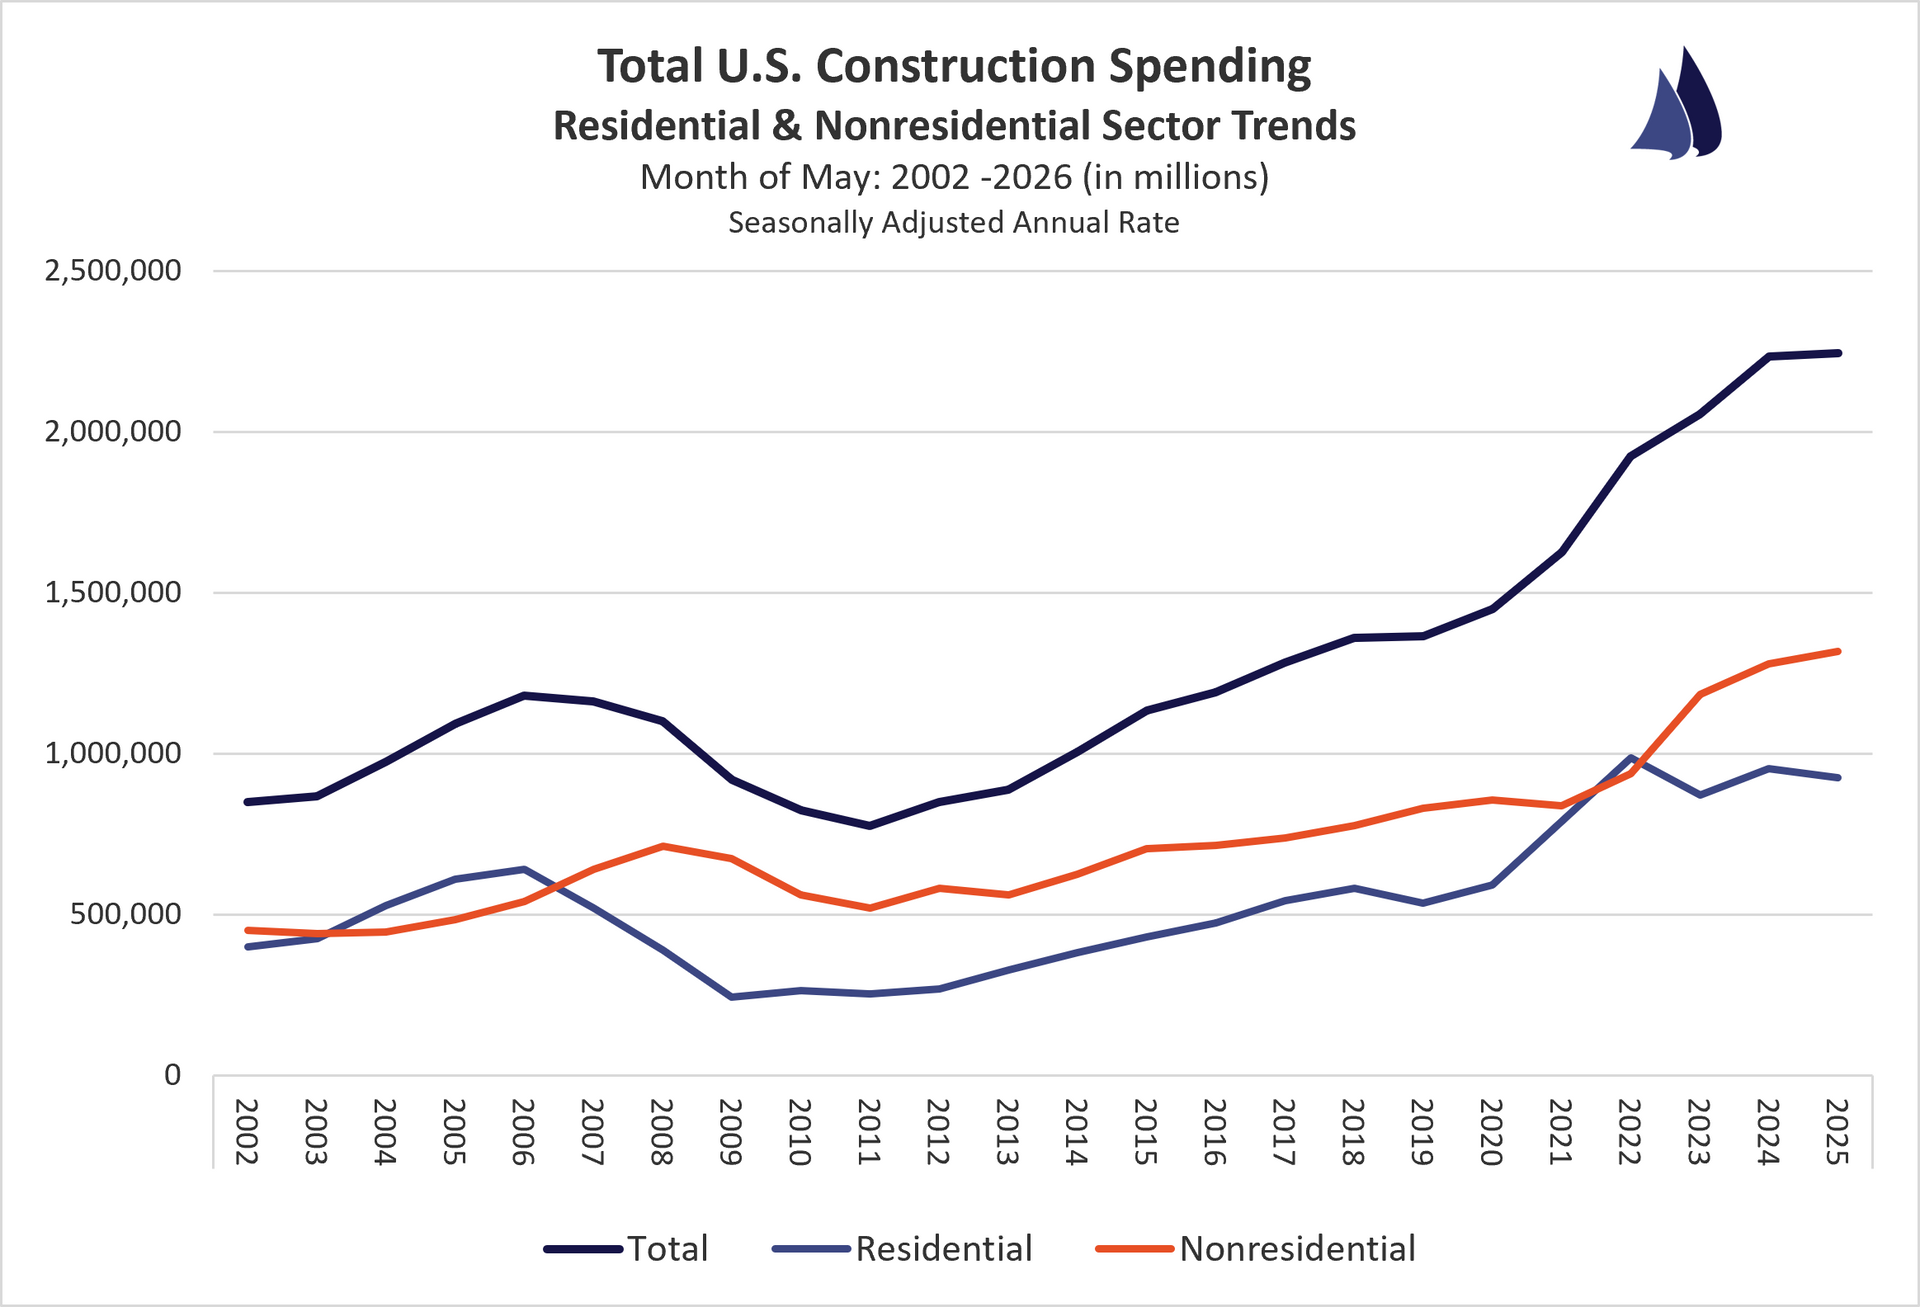
Residential Construction: +1.8%
Non-Residential Construction: -3.8%
Quick Analysis:
Total construction spending was down 1.5% year over year in May 2026 on a seasonally adjusted basis, with nonresidential the primary drag at negative 3.8% while residential posted a 1.8% gain. Within private nonresidential, manufacturing led the decline at negative 21.9%, followed by lodging at negative 10.7%, and commercial at negative 6.0%, while office bucked the trend with a 3.6% increase. Public construction spending was essentially flat year over year at plus 0.3%, with highway and health care both showing modest gains offset by declines in educational and public safety categories.
https://www.census.gov/construction/c30/c30index.html
Construction Costs
ENR Construction Cost Index
July 2026 vs. July 2025
Total Construction Costs: +3.0%
Building Cost Index: +4.5%
Material Cost Index: +7.4%
Skilled Labor Costs: +2.0%
Common Labor Costs: +1.3%
Quick Analysis:
The ENR Construction Cost Index shows total construction costs up 3.0% year over year in July 2026, with material costs the clear driver of inflation at plus 7.4%. The Building Cost Index rose 4.5%, reflecting the heavier weighting toward materials in that measure versus the broader total cost index. Labor costs grew at a much slower pace, with skilled labor up 2.0% and common labor up just 1.3%, underscoring that materials, not wages, are pushing costs higher this year.
http://enr.construction.com/economics/
Construction Employment
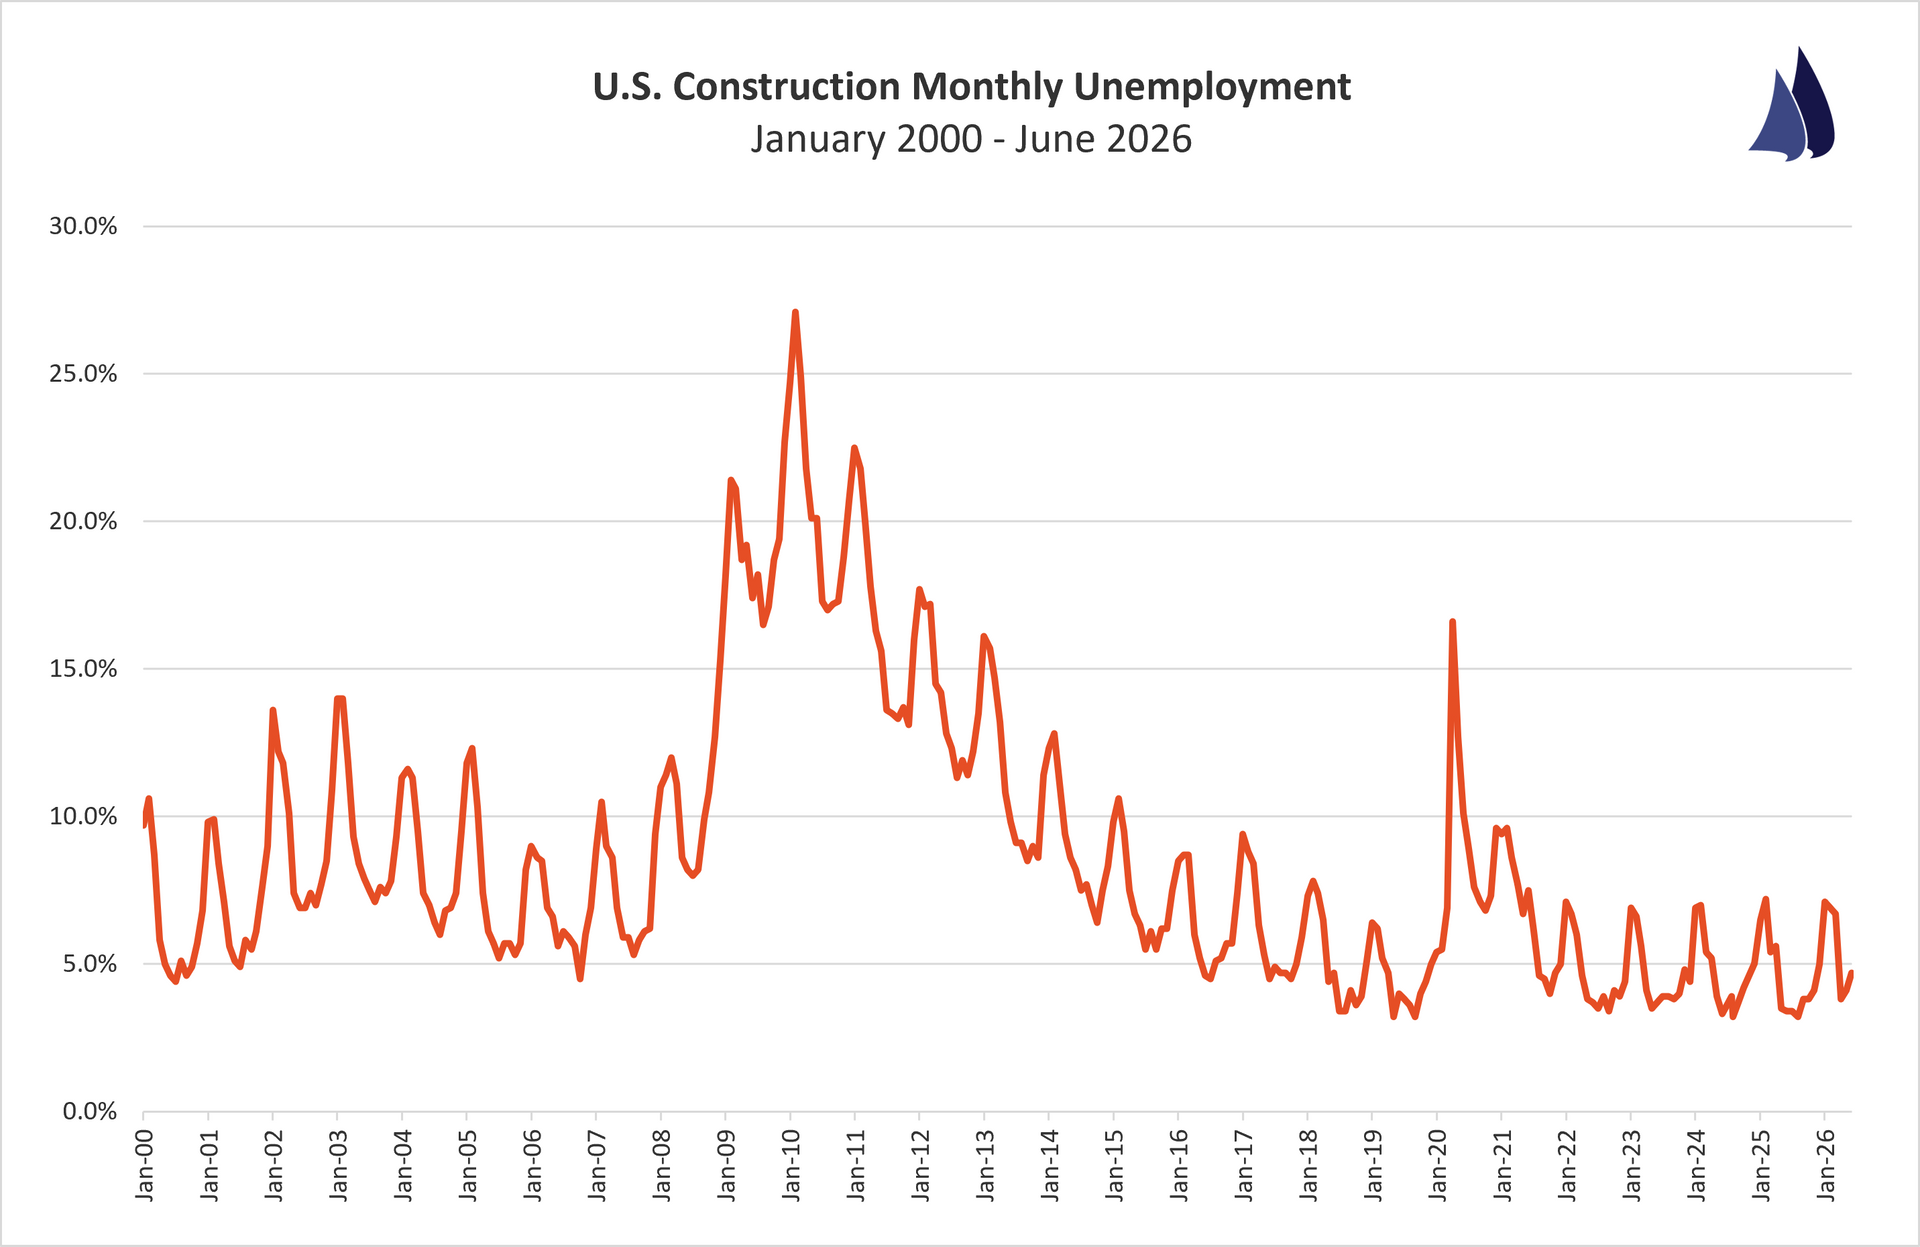
U.S. Bureau of Labor Statistics
June 2026
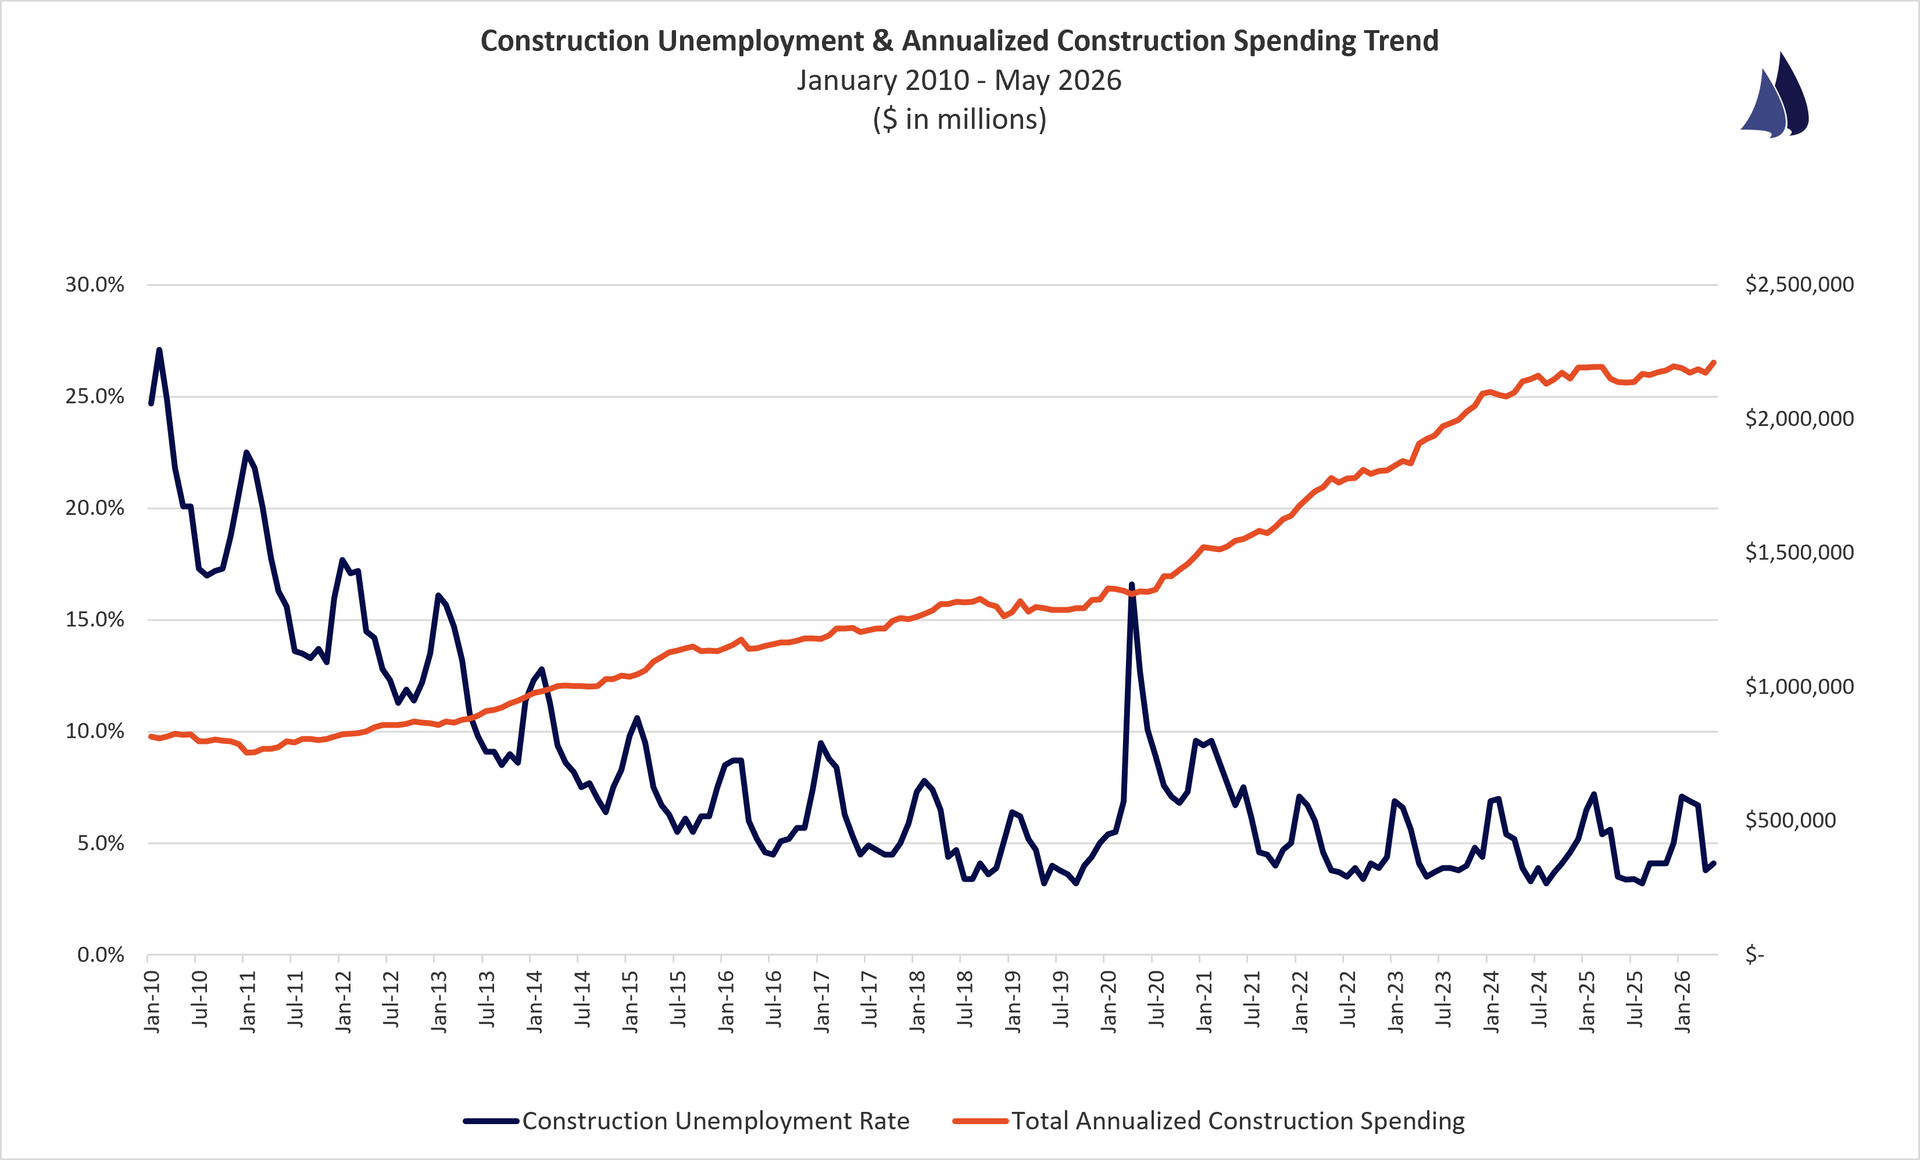
Construction Unemployment: 4.1%
Quick Analysis:
Construction industry unemployment (NSA) came in at 4.7% for June 2026, up 1.3 percentage points from June 2025's 3.4% and the highest June reading since 2021's 7.5%. Since 2022, June rates had settled into a tight 3.3% to 3.7% range as the labor market stayed historically tight, so this year's jump breaks a four-year pattern of steady, low mid-year unemployment. Combined with the run-up from April's 3.8% to May's 4.1% to June's 4.7%, this points to genuine cooling in construction labor demand rather than normal seasonal noise.
http://data.bls.gov/timeseries/LNU04032231?data_tool=XGtable
Contractor Backlogs
ABC Backlog Indicator
June 2026 (2nd Quarter)
National Avg. Backlog: 8.8 months
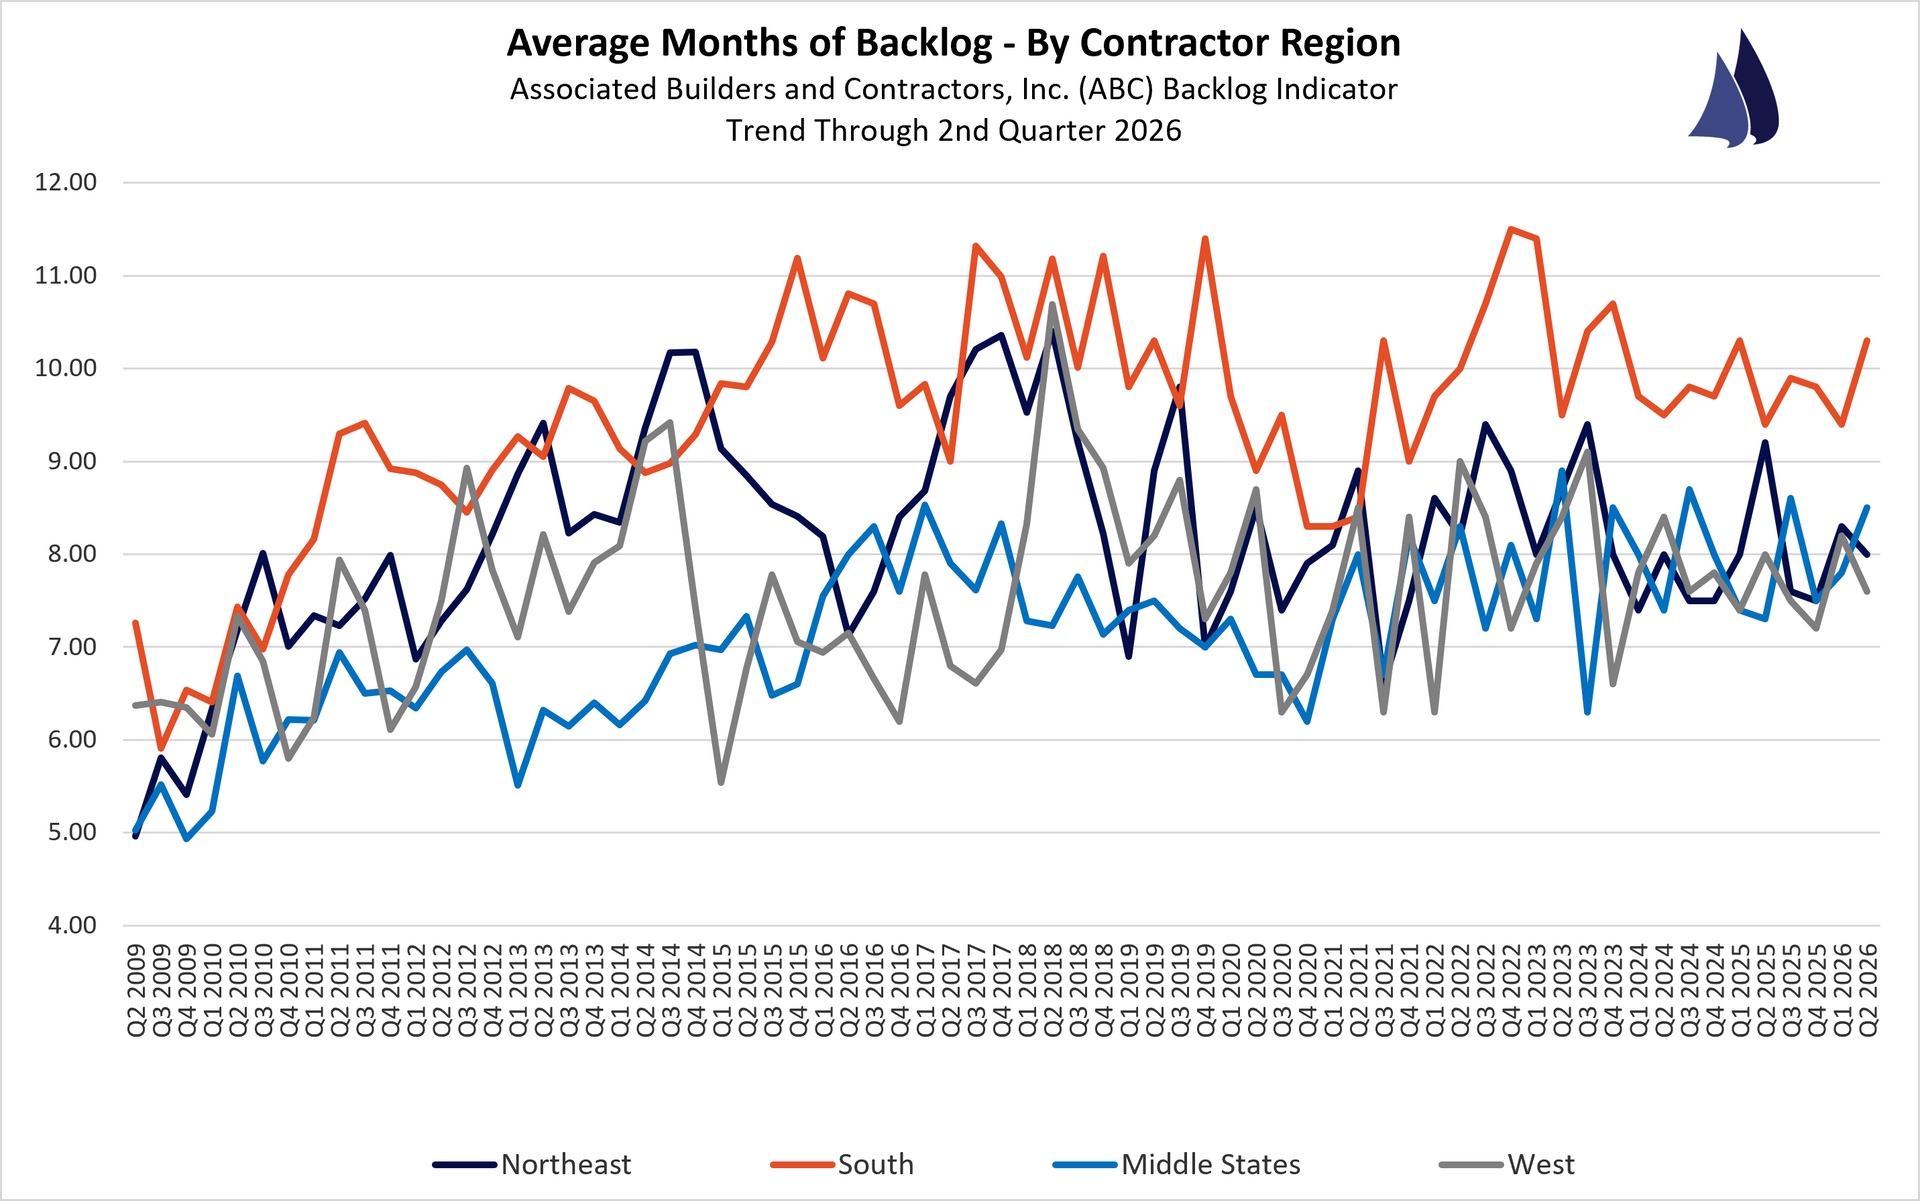
Backlog By Region:
South: 10.3 months Northeast: 8.0 months Middle States: 8.5 months West: 7.6 months
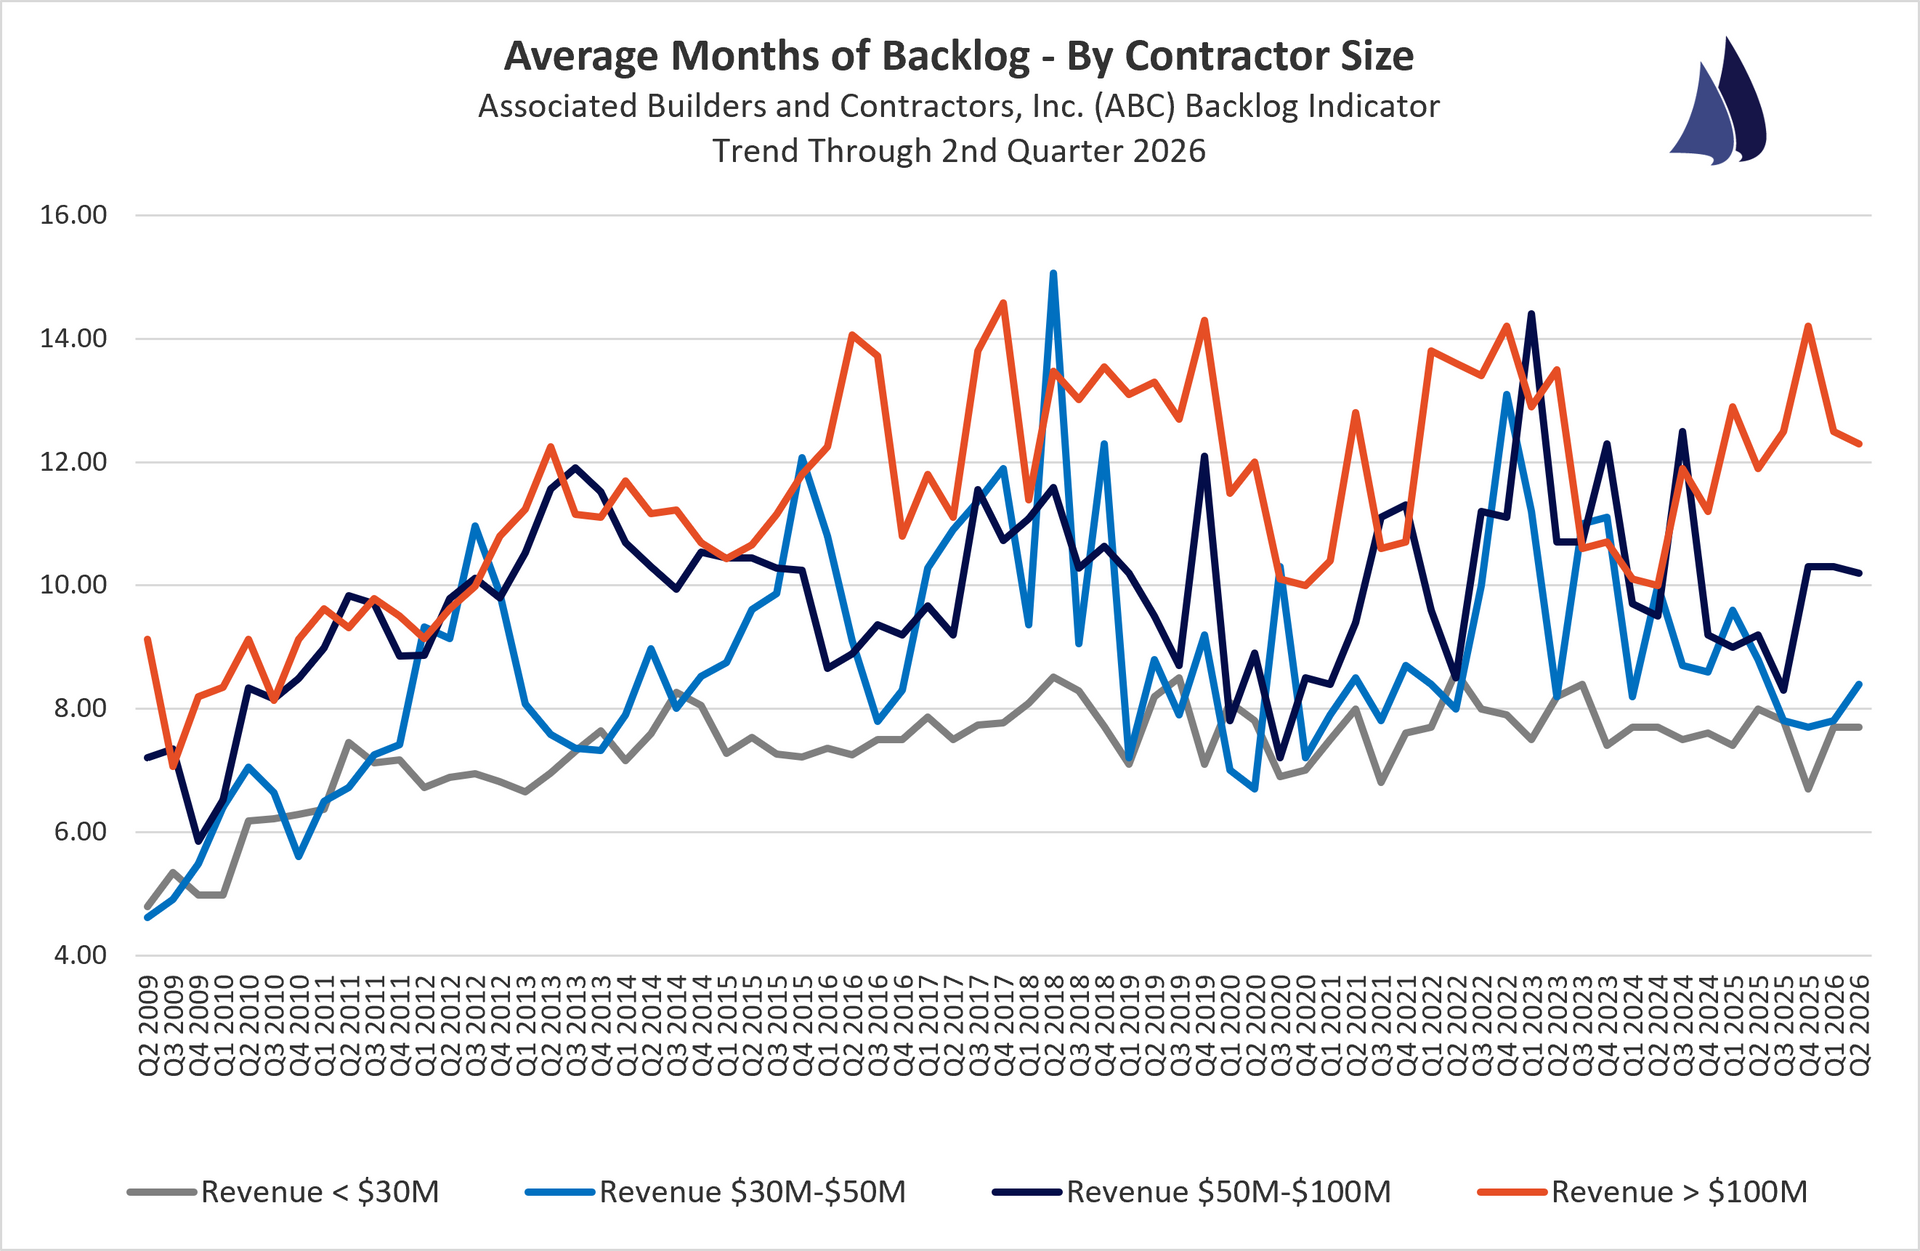
Backlog By Company Revenue:
<$30 Million: 7.7 months $30-$50 Million : 8.4 months $50-$100 Million: 10.2 months >$100 Million: 12.3 months
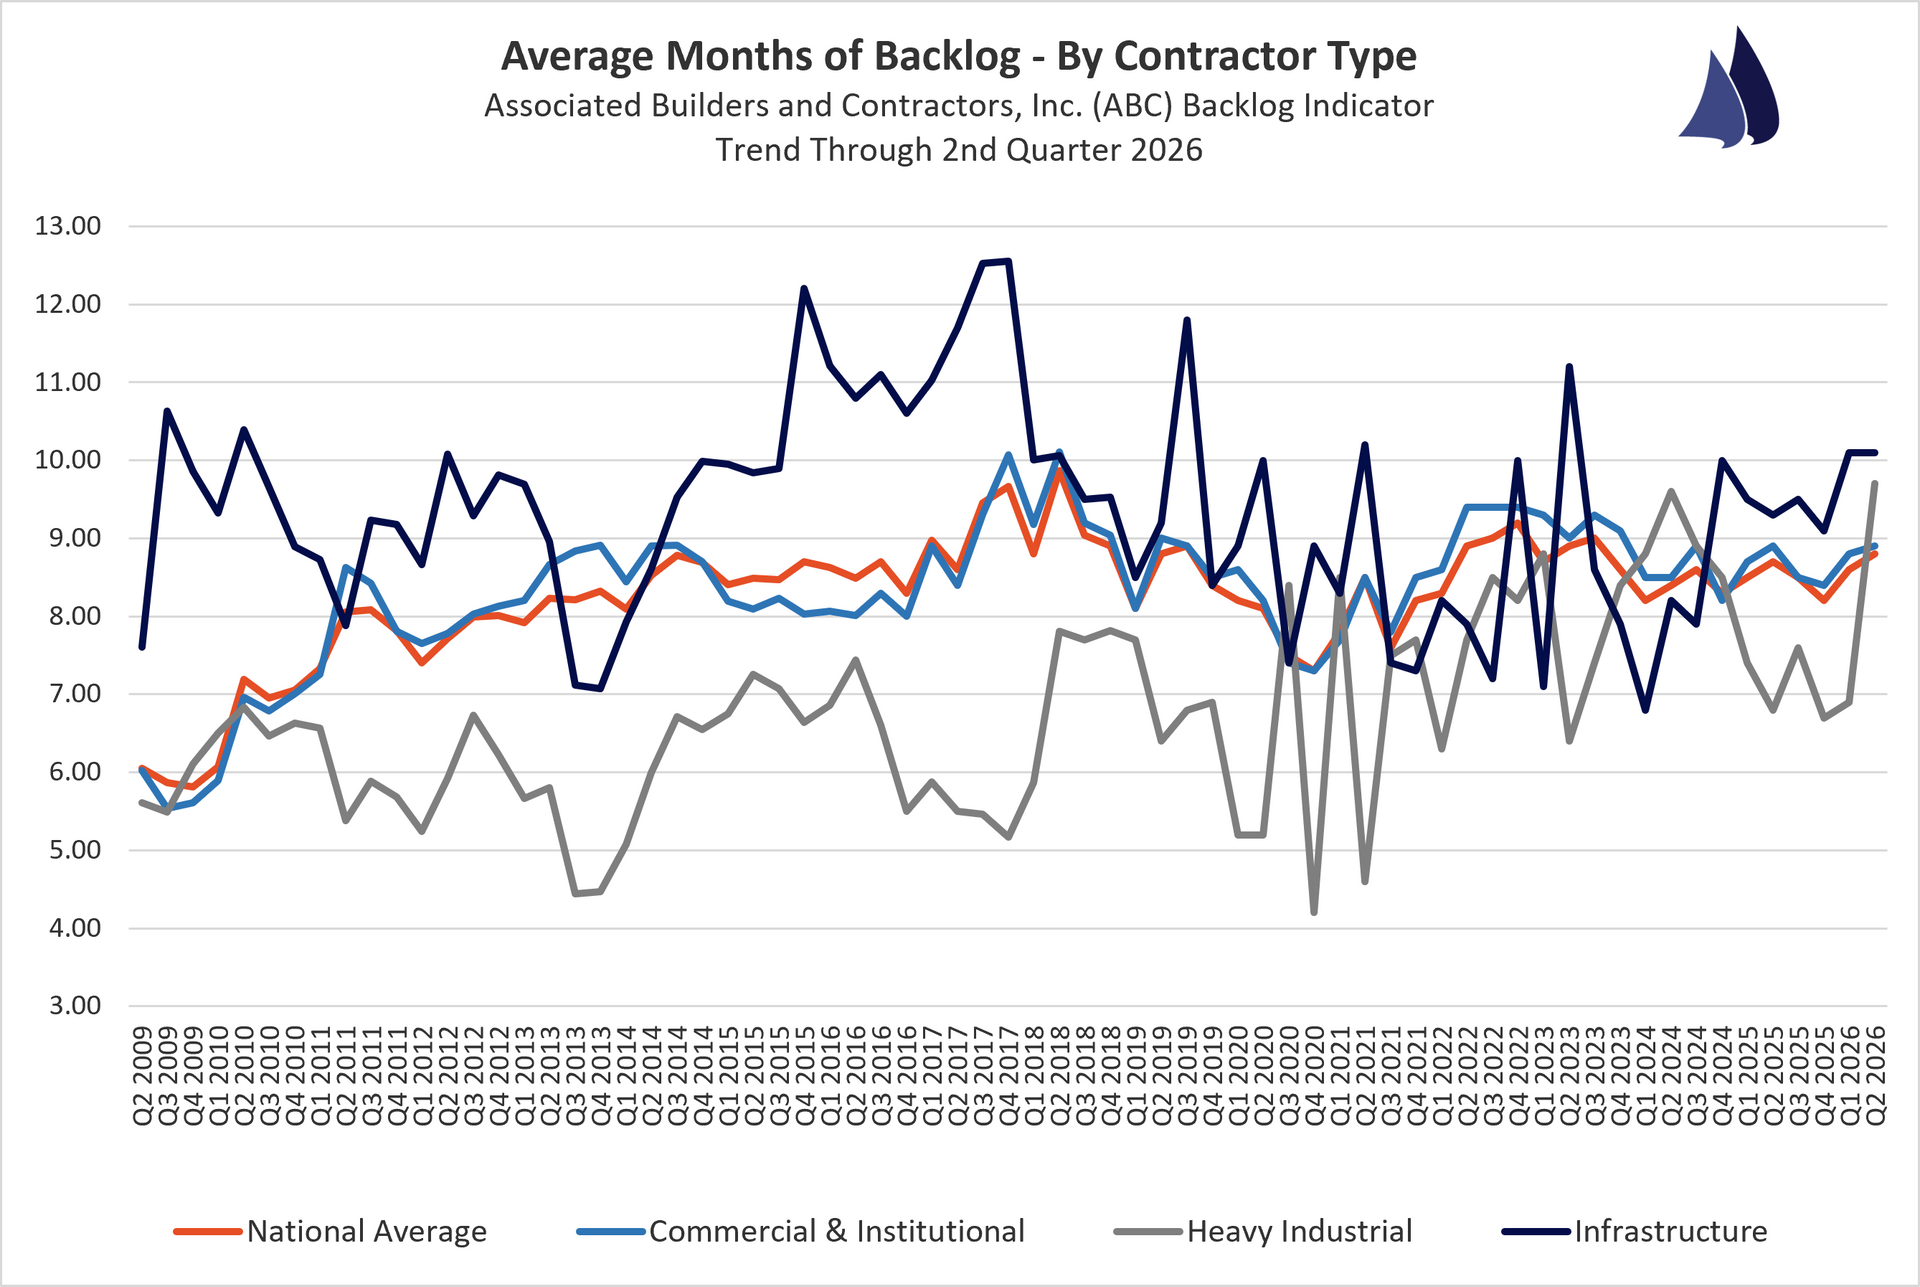
Backlog By Industry:
Commercial & Institutional: 8.9 months | Heavy Industrial: 9.7 months | Infrastructure: 10.1 months
Quick Analysis:
ABC's Construction Backlog Indicator stood at 8.8 months in June, up 0.1 months from June 2025, with backlog now higher than any point since September 2023. That resilience is concentrated at the top of the market: the 13% of contractors with data center work under contract carry an 11.0-month backlog versus 8.5 months for the other 87%, and just 8% of contractors under $100 million in revenue have data center work compared with 41% of those above $100 million. Contractor confidence remains solid year over year, with sales and staffing outlook readings up and all three Construction Confidence Index components still above the growth threshold of 50, though profit margin confidence has slipped to a seven-month low on rising input costs.
http://www.abc.org/NewsMedia/ConstructionEconomics/ConstructionBacklogIndicator/
Data Which Reflects Where the Industry Is Headed
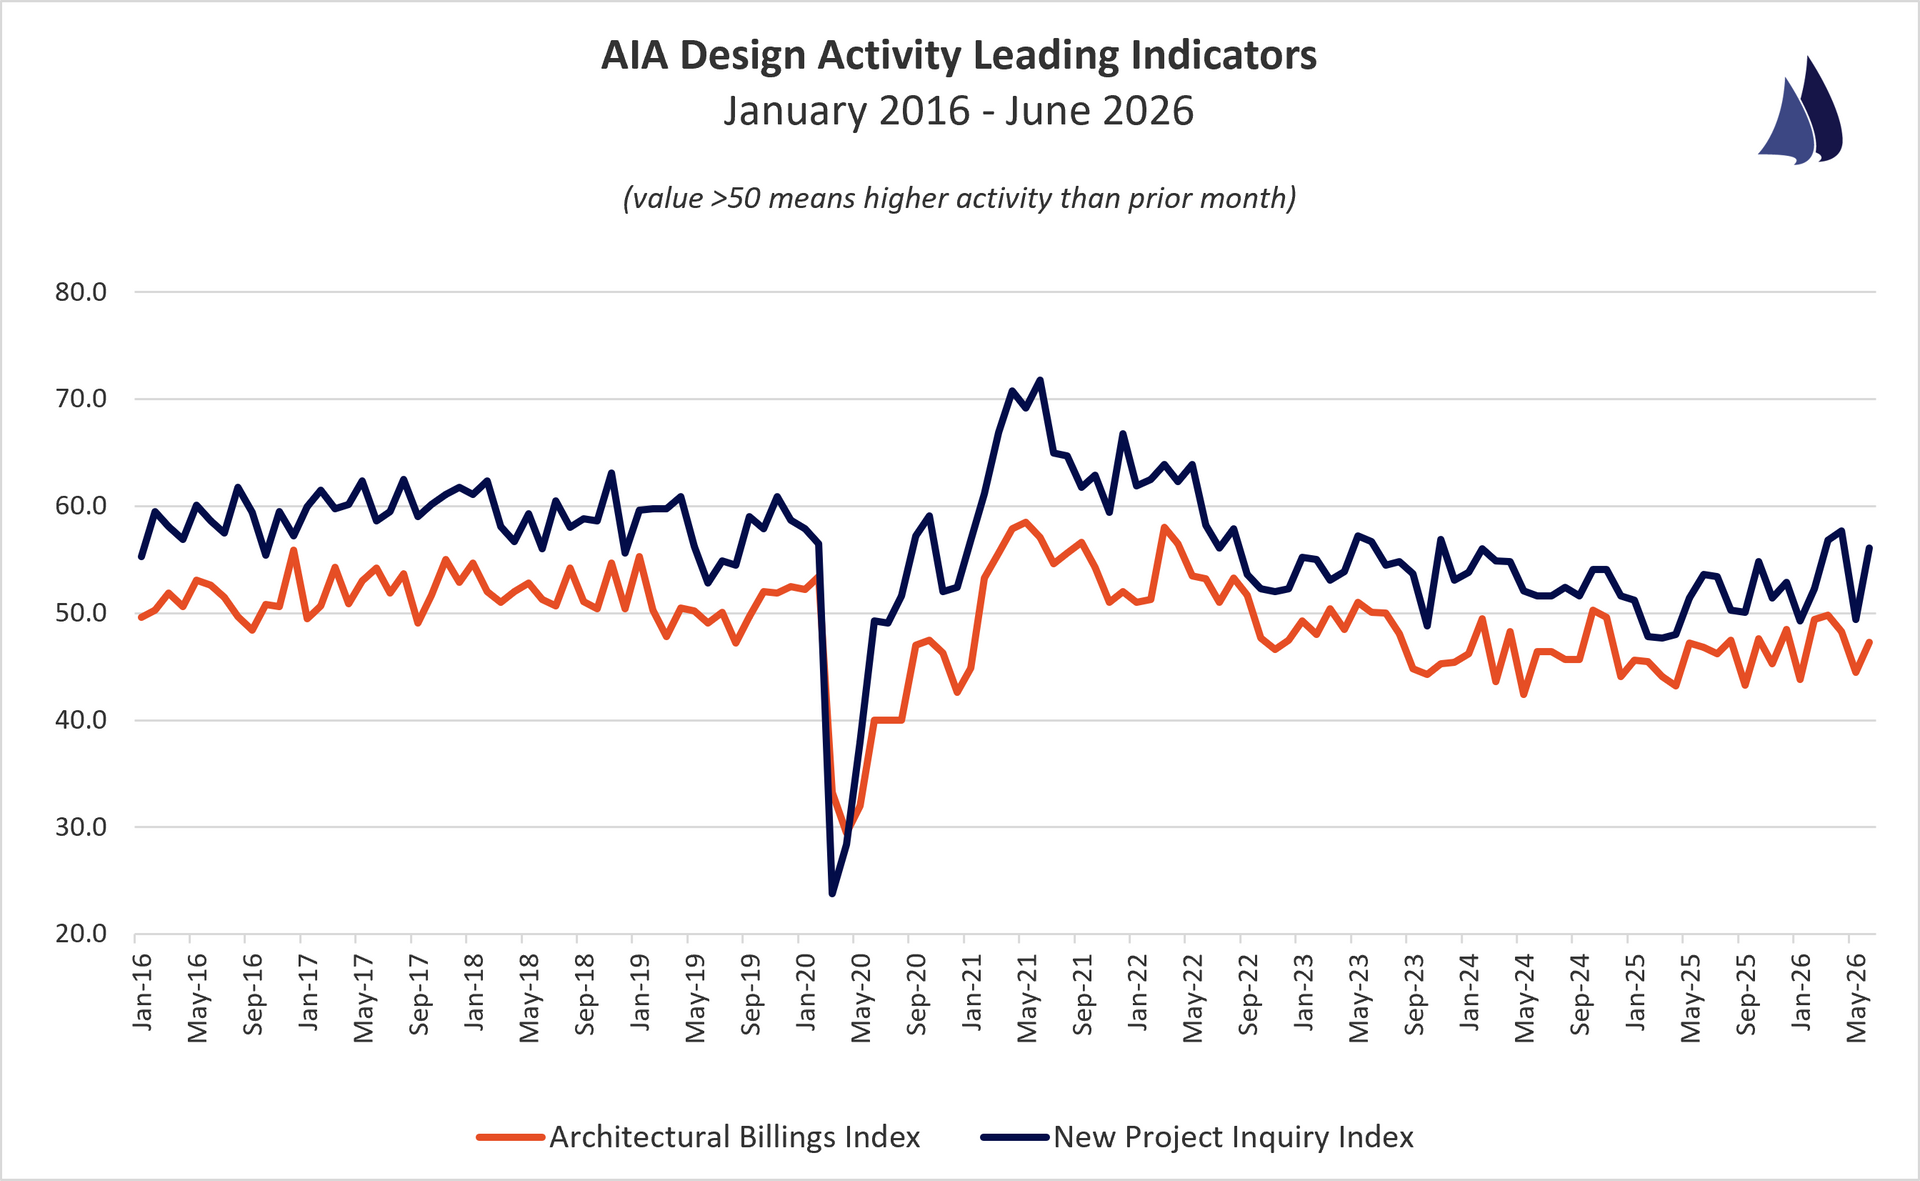
Architectural Billings
AIA Architectural Billings Index
June 2026
Architectural Billings Index (ABI): 47.3
New Design Contract Index (DCI): 49.8
Commercial/Industrial ABI: 46.7
Institutional ABI: 47.4
Multi-Family Residential ABI: 45.6
Mixed Practice ABI: 42.7
South Region ABI: 49.5
West Region ABI: 45.6
Midwest Region ABI: 45.1
Northeast Region ABI: 44.9
New Project Inquiry Index (NPII): 56.1
Quick Analysis:
Index value > 50 represents that architects have reported more activity for that particular metric than the prior month. These metrics are leading indicators as the ABI reflects projects in design that will enter the construction phase in 9 to 12 months and the NPII reflects new project demand from owners to potentially enter the design phase.
The Architecture Billings Index rose to 47.3 in June 2026, up nearly three points from May's 44.5, though both readings remain below the 50-point growth threshold and the index has now signaled contraction for 34 of the last 35 months. Sector breakdown shows a shift in relative strength: institutional (47.4) and commercial/industrial (46.7) are both softer than a year ago (49.2 and 47.4, respectively), while multifamily residential improved meaningfully to 45.6 from 43.8. Regionally the South remains the strongest at 49.5, essentially flat with last June's 50.6, while the Northeast, Midwest, and West all continue to post scores in the mid-to-high 40s, indicating broad-based softness has persisted rather than resolved over the past year.
http://new.aia.org/press-releases