
Construction Economics Hub
Catalyst Construction Economics Hub
Know where the industry is.Know where it's headed.
Data Which Reflects Where the Industry Is Today
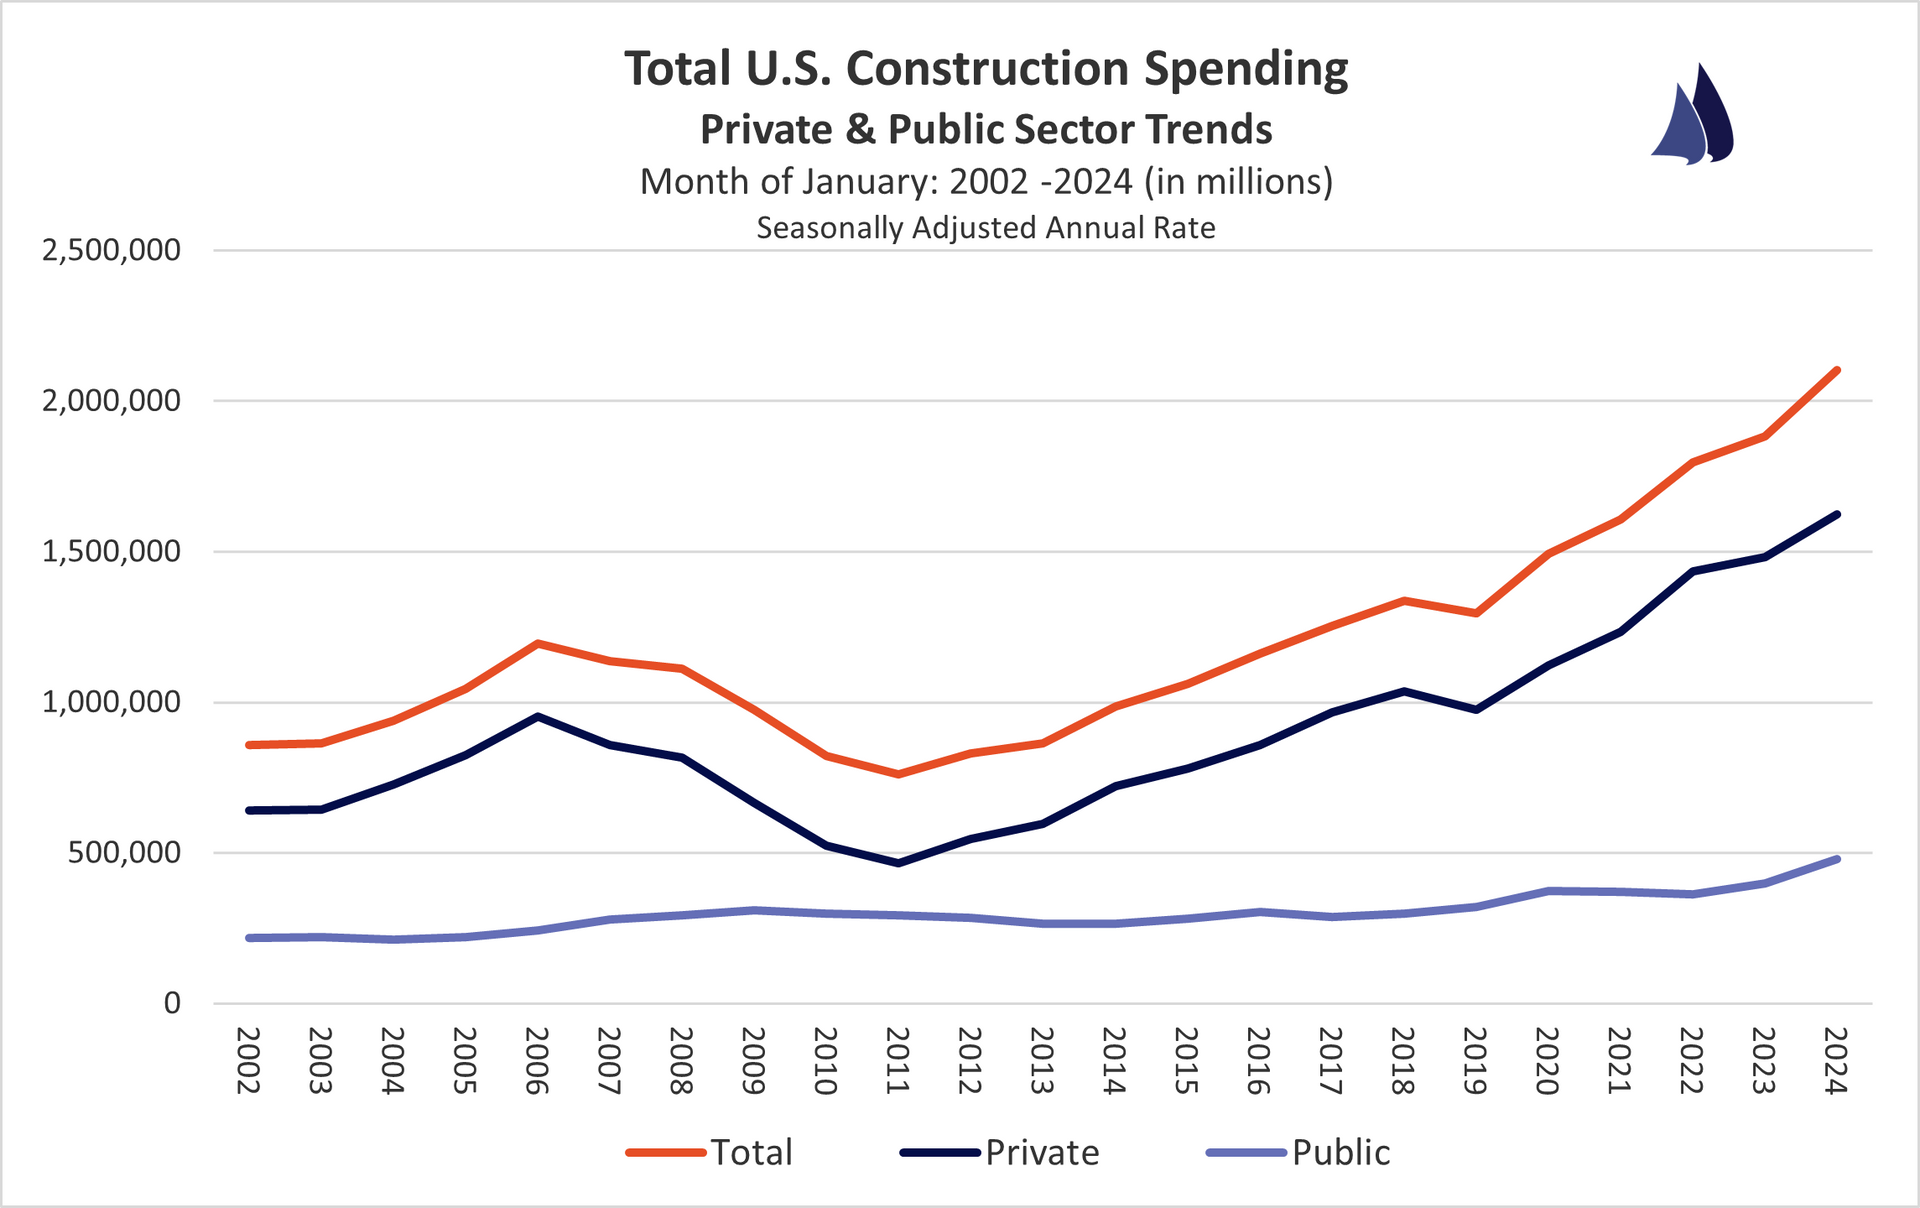
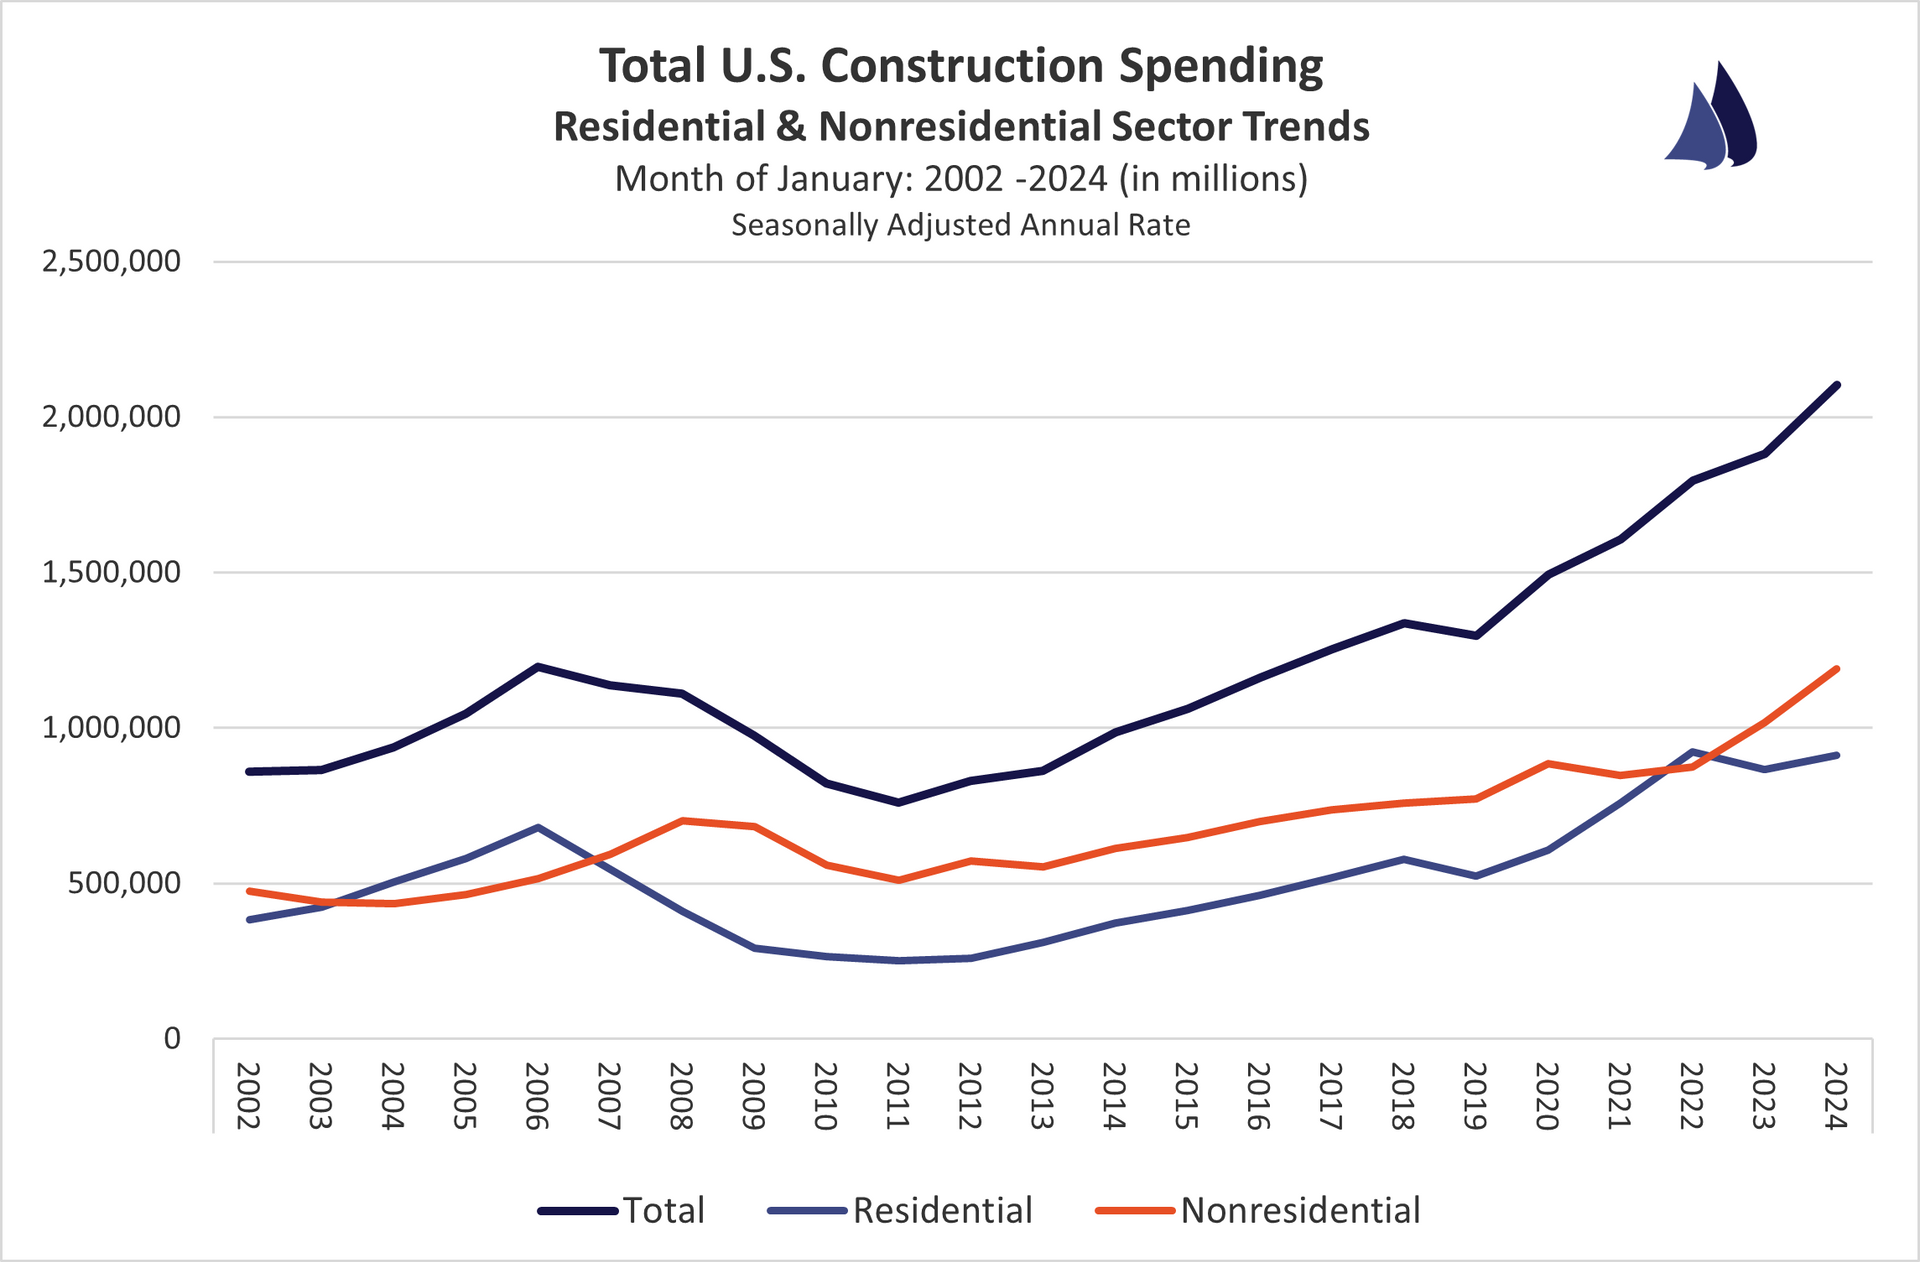
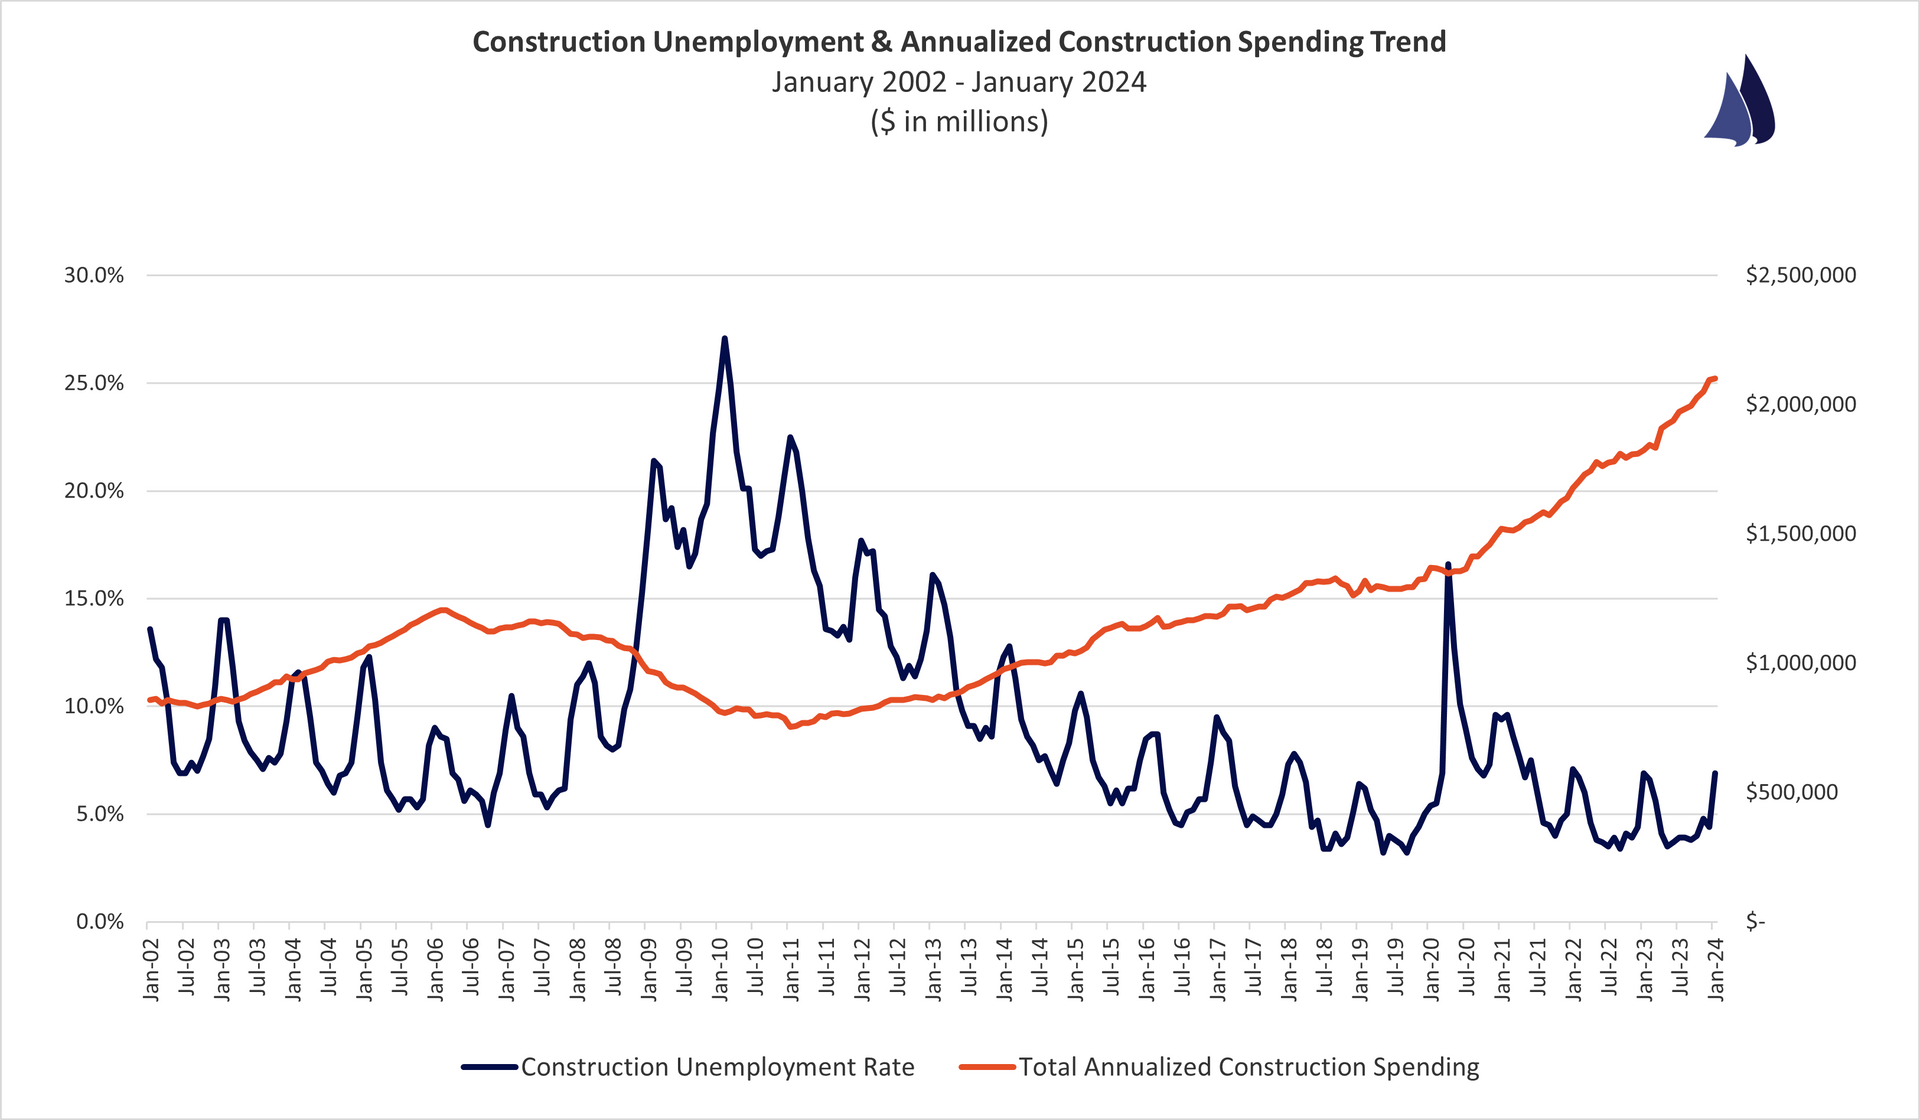
Construction Spending
U.S. Census Bureau - Construction Spending
Year-To-Date Annual Total - Seasonally Adjusted Annual Rate
January 2024 vs. January 2023
All Construction Spending: +11.7%
Public Construction: +20.1%
Private Construction: +9.5%
Residential Construction: +5.4%
Non-Residential Construction: +17.1%
Quick Analysis:
Spending growth continues to be driven by the non-residential and public segments. The January 2024 data also shows that spending is up versus 2023 in every type of the construction that the Census Bureau breaks out.
Notable Increases/Decreases By Sector:
- Manufacturing - Spending is up 36.6% versus 2022
- Sewage - Spending is up 23.9% versus 2022
- Water Supply - Spending is up 22.2% versus 2022
- Highway & Street - Spending is up 22.0% versus 2022
- Educational - Spending is up 19.6% versus 2022
- New Single-Family Residential - Spending is up 12.5% versus 2022
https://www.census.gov/construction/c30/c30index.html
Construction Costs
ENR Construction Cost Index
March 2024 vs. March 2023
Total Construction Costs: +2.7%
Building Cost Index: +3.8%
Material Cost Index: +6.2%
Skilled Labor Costs: +3.0%
Common Labor Costs: +2.0%
Quick Analysis:
The pace of material cost increases versus the prior year has ticked up slightly in early 2024. That said, inflation across materials is certainly well below what the industry experienced in 2022.
http://enr.construction.com/economics/
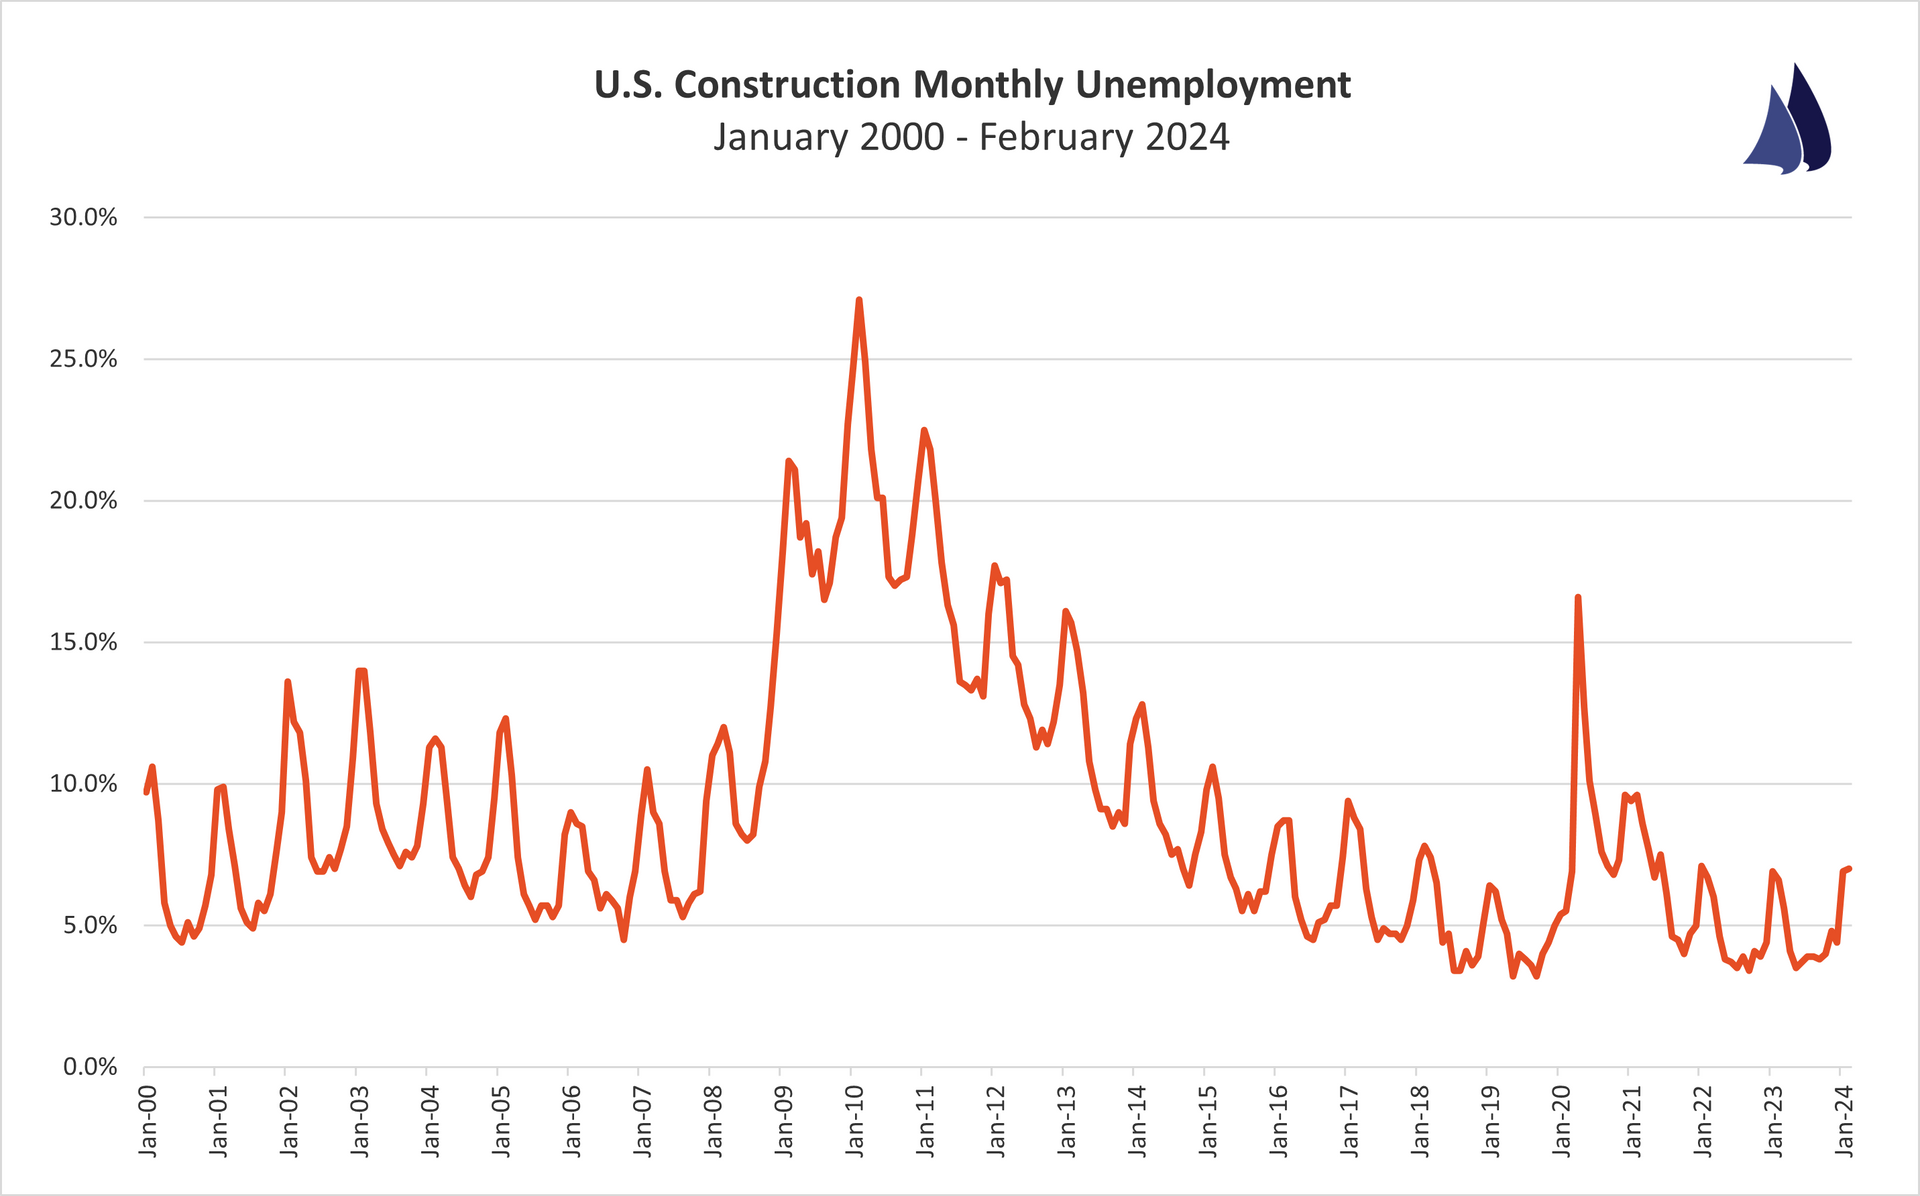
Construction Employment
U.S. Bureau of Labor Statistics
February 2024
Construction Unemployment: 7.0%
Quick Analysis:
The industry's unemployment rate for the month of February was 7.0%. Overall, unemployment remains on par with the industry's unemployment rate reported for February of 2023. Needless to say, the labor market remains tight.
http://data.bls.gov/timeseries/LNU04032231?data_tool=XGtable
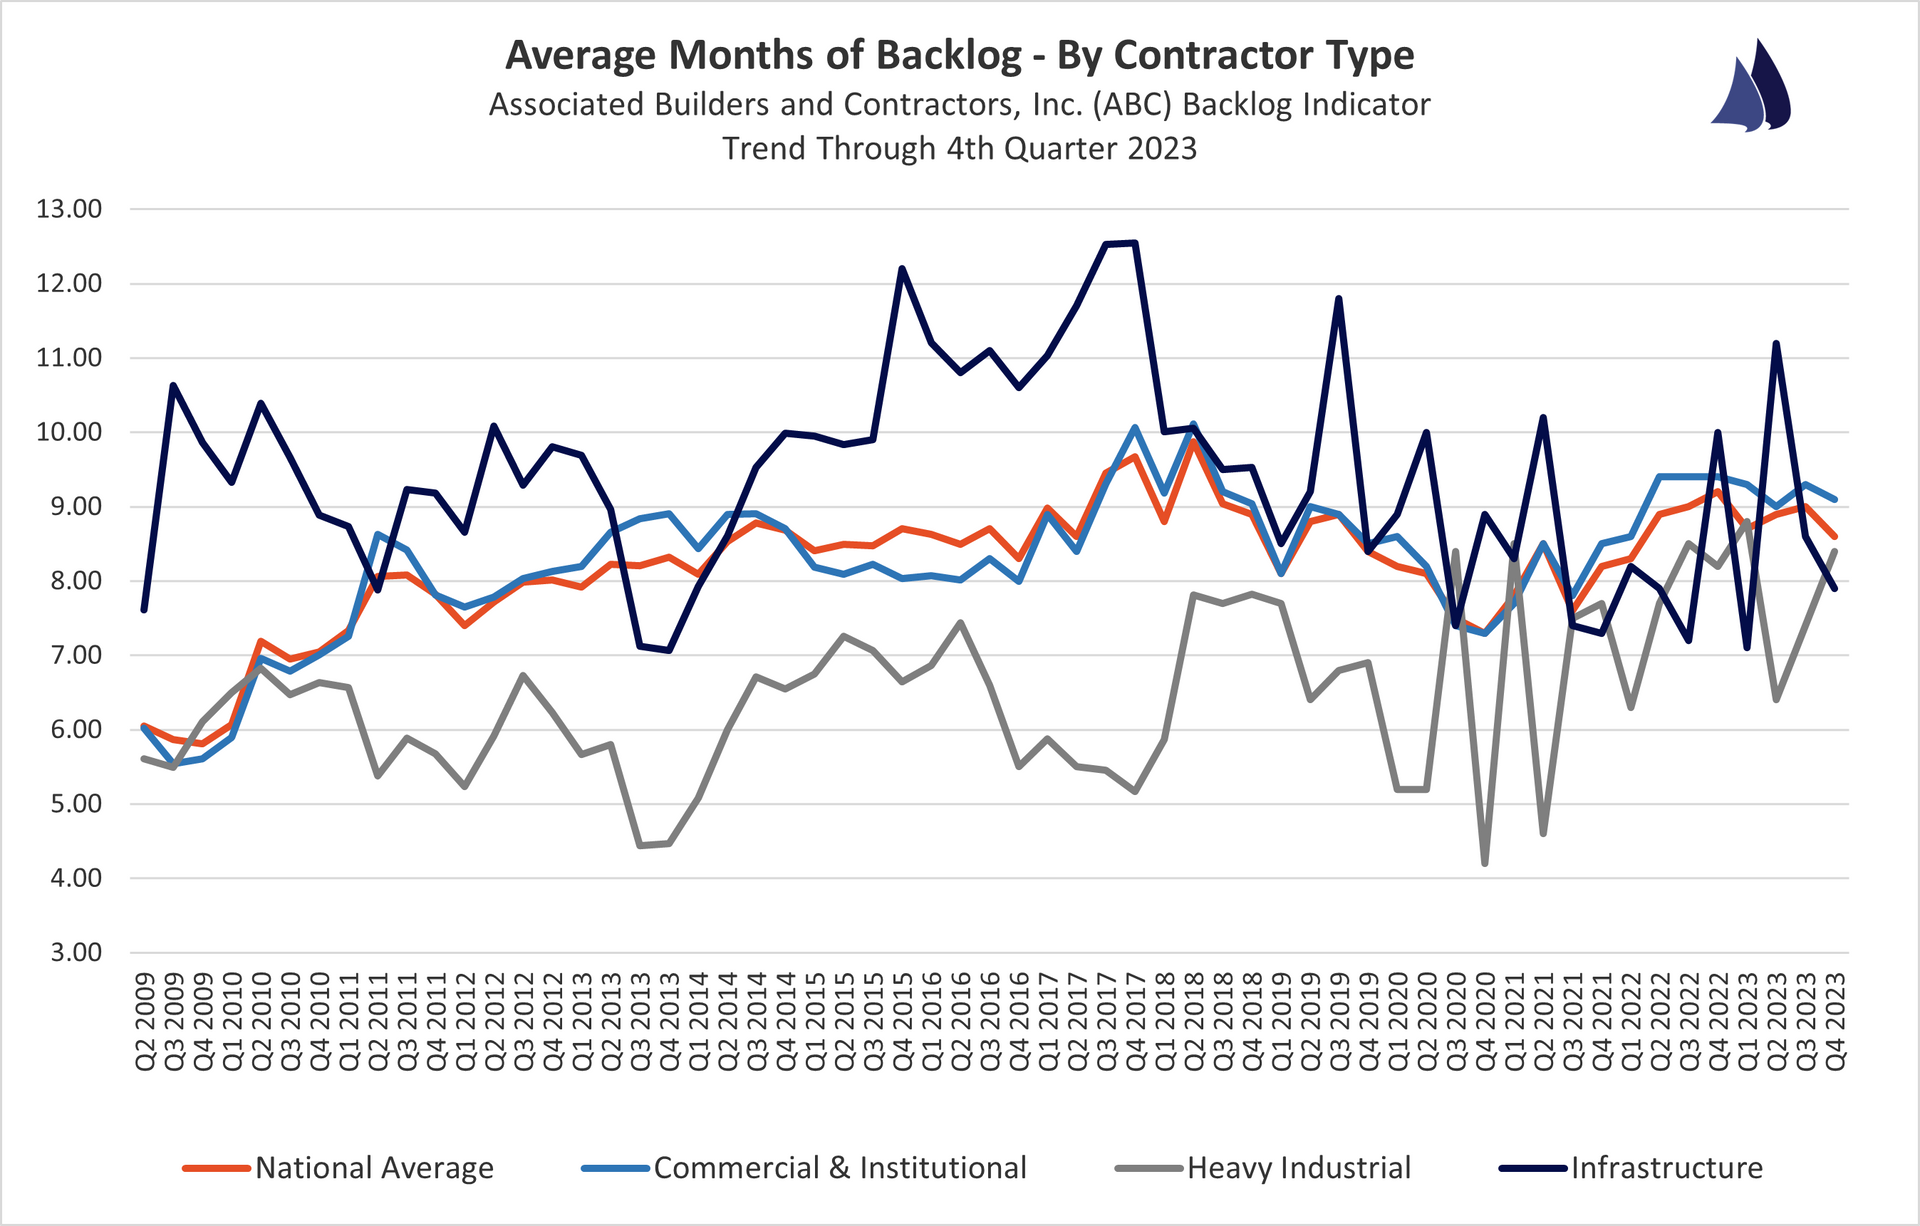
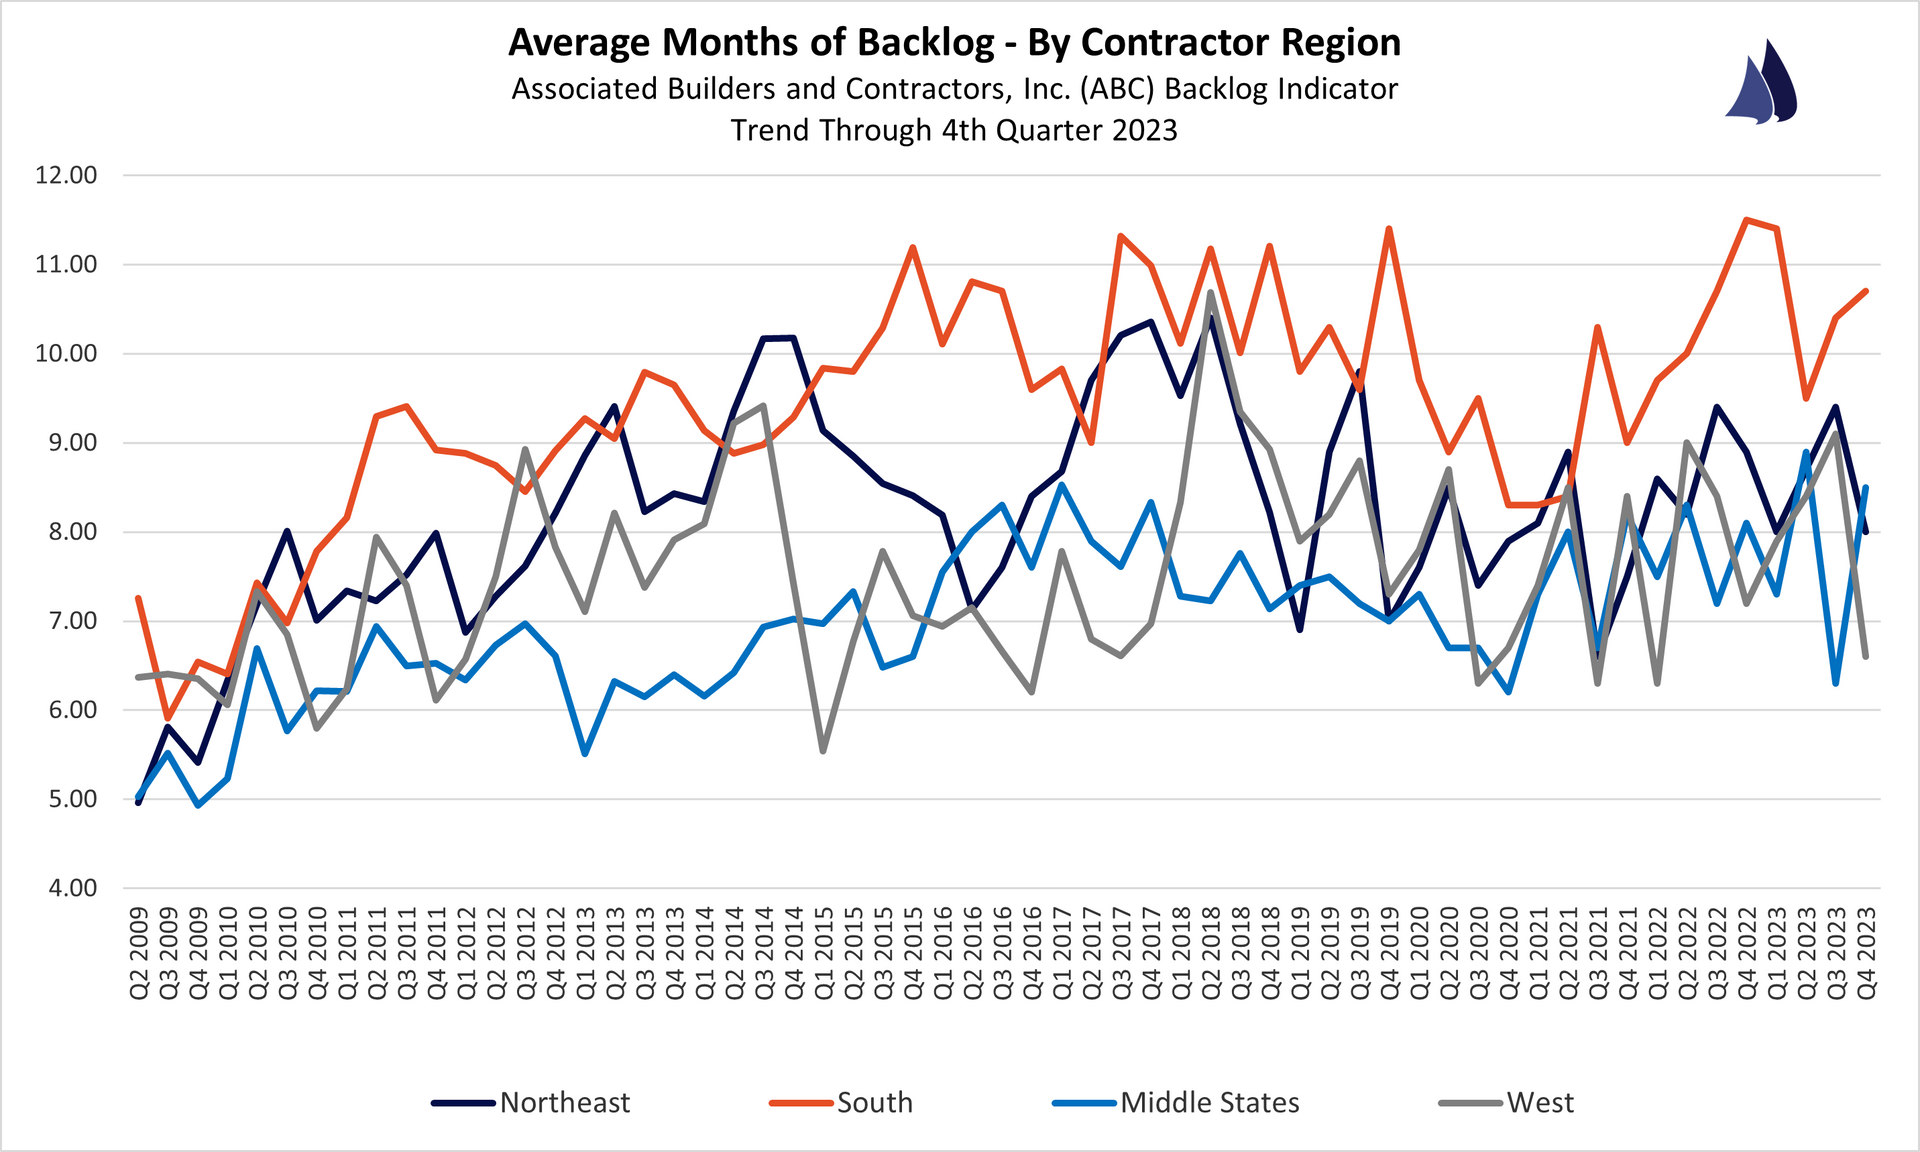
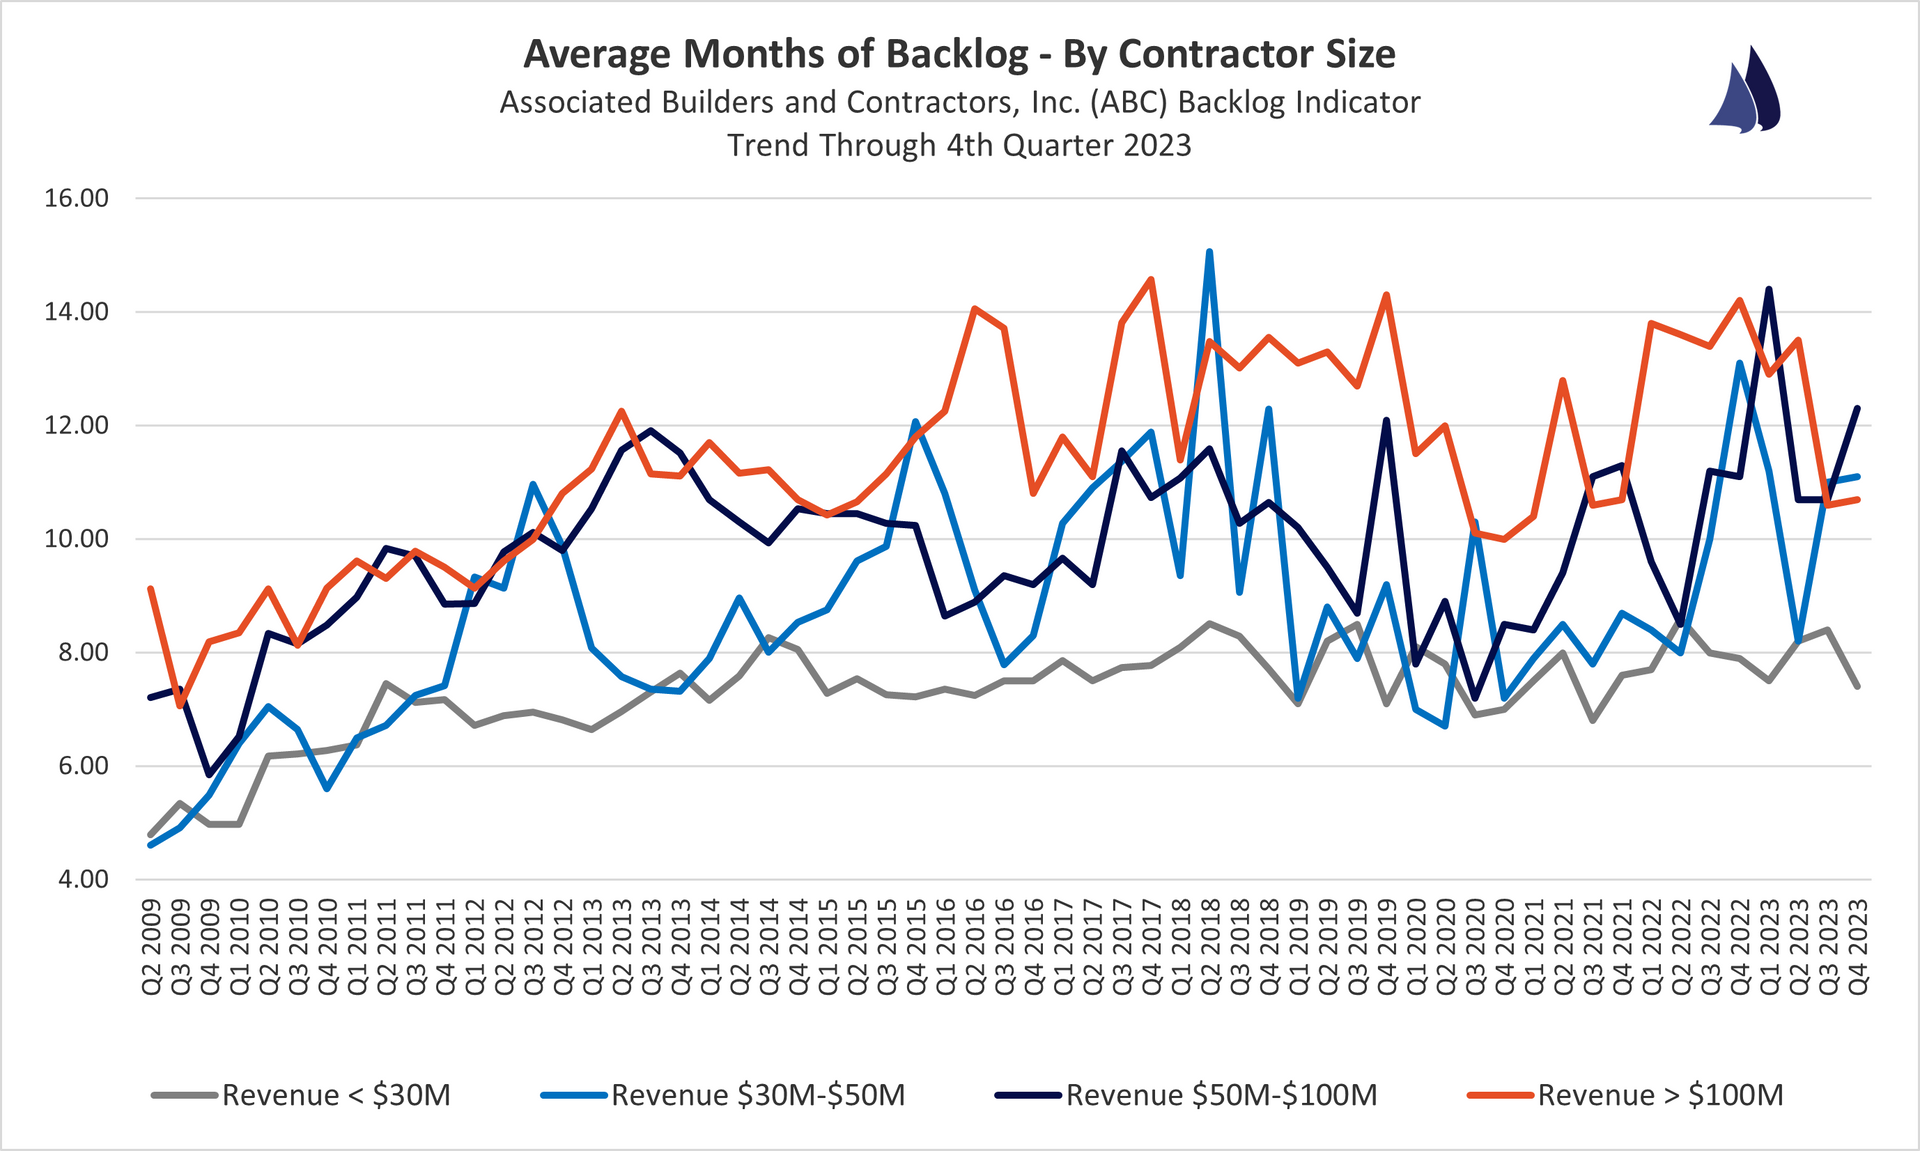
Contractor Backlogs
ABC Backlog Indicator
December 2023 (4th Quarter)
National Avg. Backlog: 8.6 months
Backlog By Region:
South: 10.7 months | Northeast: 8.0 months | Middle States: 8.5 months | West: 6.6 months
Backlog By Company Revenue:
<$30 Million: 7.4 months | $30-$50 Million : 11.1 months | $50-$100 Million: 12.3 months | >$100 Million: 10.7 months
Backlog By Industry:
Commercial & Institutional: 9.1 months | Heavy Industrial: 8.4 months | Infrastructure: 7.9 months
http://www.abc.org/NewsMedia/ConstructionEconomics/ConstructionBacklogIndicator/
Data Which Reflects Where the Industry Is Headed
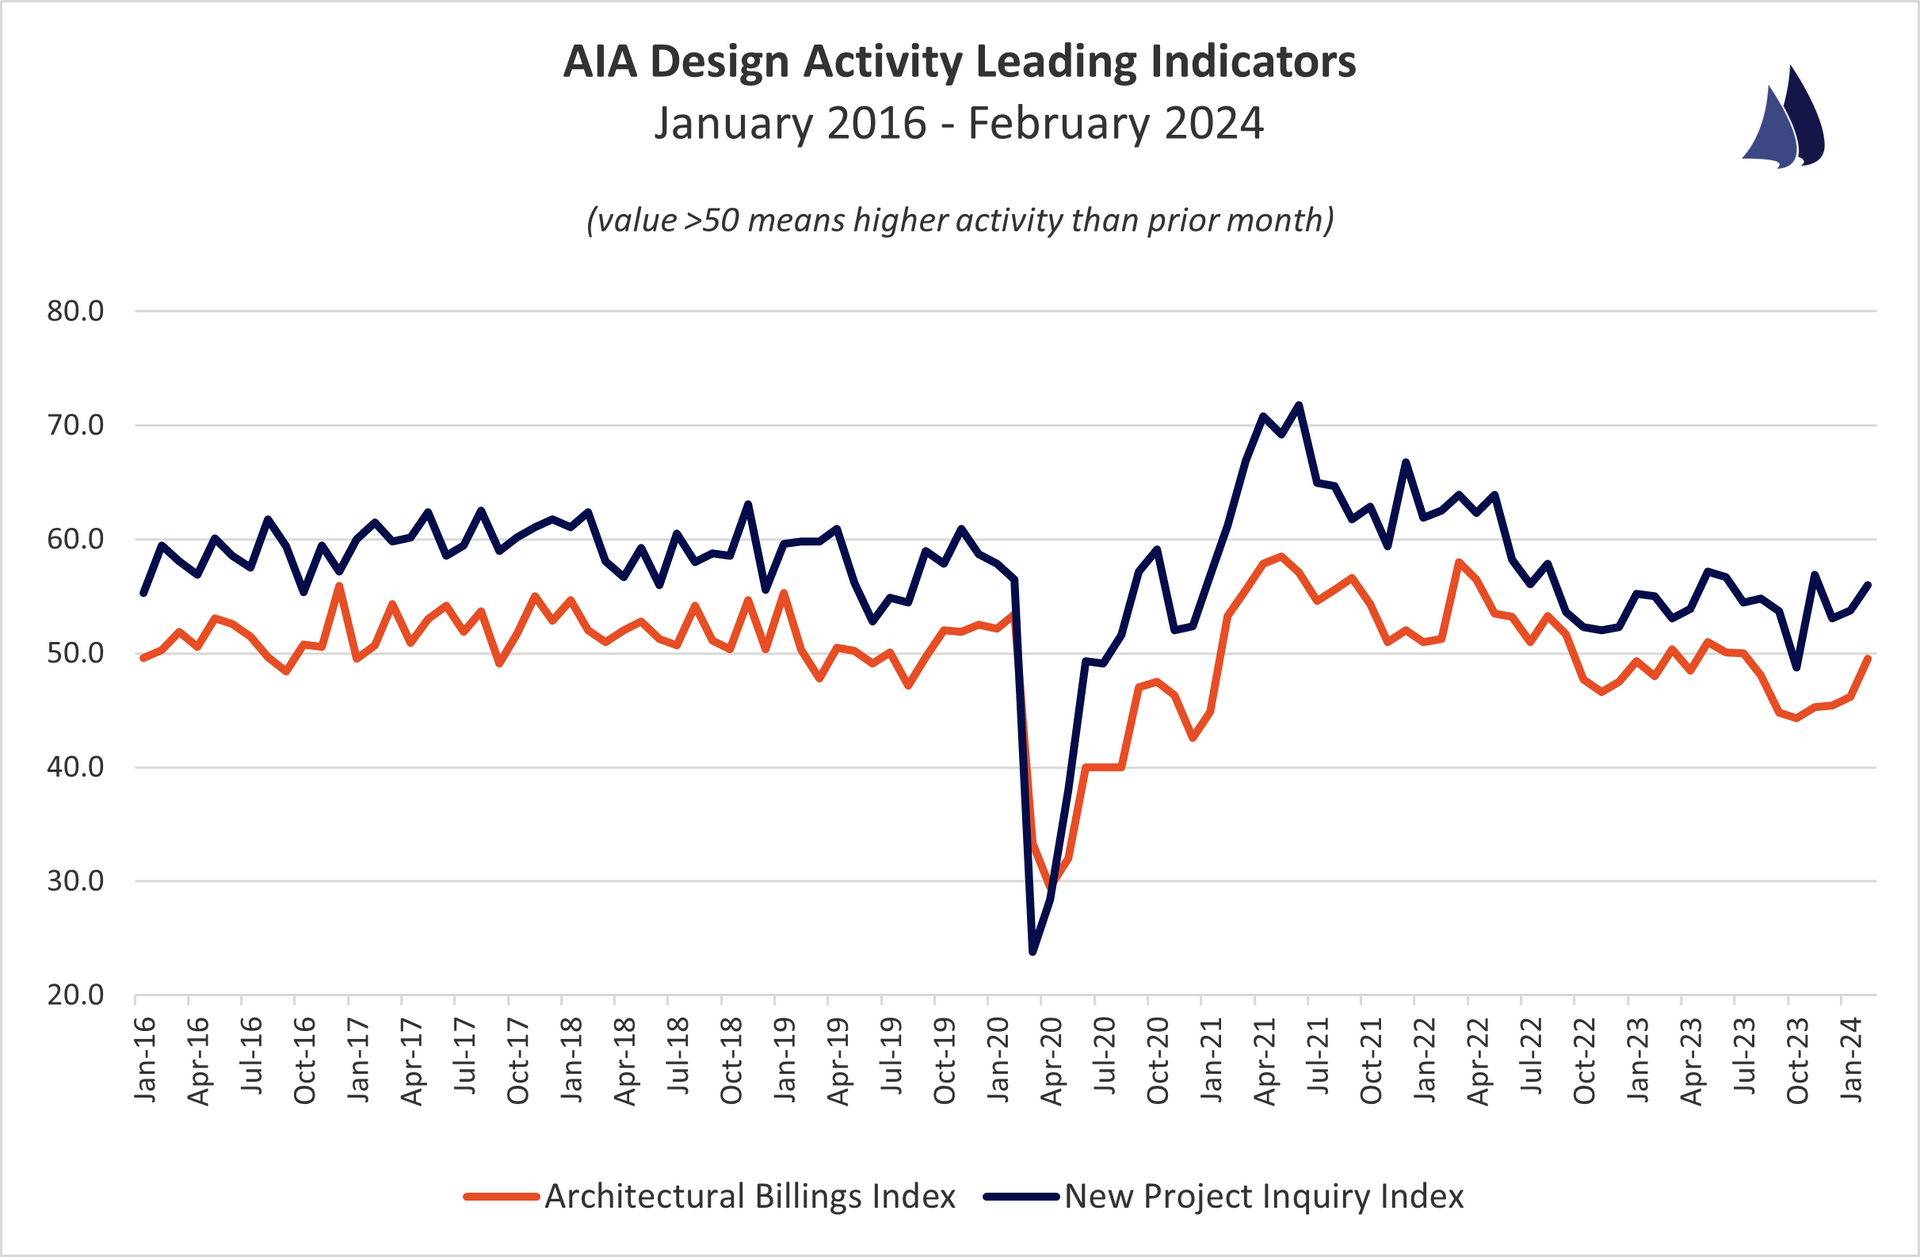
Architectural Billings
AIA Architectural Billings Index
February 2024
Architectural Billings Index (ABI): 49.5
New Design Contract Index (DCI): 51.1
Commercial/Industrial ABI: 46.1
Institutional ABI: 50.7
Multi-Family Residential ABI: 44.9
Mixed Practice ABI: 47.1
South Region ABI: 47.7
West Region ABI: 47.2
Midwest Region ABI: 50.8
Northeast Region ABI: 44.0
New Project Inquiry Index (NPII): 56.0
Quick Analysis:
Index value > 50 represents that architects have reported more activity for that particular metric than the prior month. These metrics are leading indicators as the ABI reflects projects in design that will enter the construction phase in 9 to 12 months and the NPII reflects new project demand from owners to potentially enter the design phase.
The February AIA data reflects the seventh consecutive month of monthly declines in architectural activity - the longest period of monthly declines since 2010. That said, there remains an underlying demand for new project design services which is reflected in the New Project Inquiry Index reading of 56.0. Overall, this data could very likely mean decreased construction starts and spending levels as we progress further into 2024.
http://new.aia.org/press-releases
Get This Data Delivered to Your Inbox Each Month

Simplify Your Bonding Process
About Catalyst
Catalyst Surety Partners, LLC is an independent insurance agency that specializes in providing surety bonds.
We leverage our team's deep surety knowledge along with our agency's relationships with a wide array of surety carriers to help companies improve their bonding capabilities.
Our Locations
Charlotte, NC11405 N. Community House Rd., Ste 280Charlotte, NC 28277(704) 208-4884
Columbia, SC111 Executive Center Dr., Ste 229Columbia, SC 29210(803) 828-7716
Stay Connected
Copyright 2024 - Catalyst Surety Partners, LLC